
The Gap Between Public Interest and Public Policy in Reporting of Corporate Performance on Sustainability Activities
Cynthia Phillips and Victoria Shoaf
Abstract: Traditional financial reporting models capture only transactions that are measurable according to the accounting standards promulgated in the U.S. by the Financial Accounting Standards Board (FASB) and in the international community by the International Accounting Standards Board (IASB), and thus disregard various unreported intangible assets. These omitted intangible assets, however, account for at least 84% of corporate value (Business Intangibles 2015). We focus on unreported intangible assets involving environmental, social, and governance (ESG) sustainability initiatives because of the growing pressure from stakeholders—including investors, employees, consumers, communities, and regulators—to report on them. We demonstrate empirically the value-relevance of corporate performance of ESG activities. The U.S. has considered mandating sustainability reporting for public companies (SEC Concept Release No. 33-10064; 34-77599), but to date such reporting remains largely voluntary. While the European Union (EU) has adopted mandatory reporting (Directive 2014/95/EU), the system lacks standardization.
I. Introduction
Over the last two decades, researchers have demonstrated that data included in corporate financial statements do not provide a true representation of organizational value (Gu and Lev 2015; Amir et al. 2007; Cheng 2005; Aboody and Lev 1998; Barth and Clinch 1998). Traditional financial reporting models capture only transactions that are measurable according to the accounting standards promulgated in the U.S. by the Financial Accounting Standards Board (FASB) and in the international community by the International Accounting Standards Board (IASB). Assets such as land, plants, machinery, equipment, cash, inventory, investments, and various financial instruments are measurable and recorded on the balance sheet at historical cost or market value as prescribed by the standards. Performance measures, such as return on assets (ROA), are used to evaluate the contribution of the firm’s total assets to earnings generation. Earnings in turn impact stock prices, and hence, the market value of the firm.
However, there are many assets that contribute significantly to the economic performance and market value of a company that are either not directly measurable or not permitted to be recognized in the financial statements. For instance, accounting standards prohibit internally generated intangible assets from being reported on the balance sheet. These and other unrecorded intangible assets are excluded from performance measures such as ROA. Examples of such unrecorded intangible assets include internally developed patents and copyrights, software development, product development, brand name, firm reputation, human capital/talent, and performance on environmental, social, and governance (ESG) matters. Only in the case of an acquisition are these intangibles considered for recognition; the acquiring firm will record the difference between the acquired company’s book value and the amount paid for the acquisition as goodwill on its consolidated balance sheet. As such, goodwill will include the sum total of all intangible assets contributing to the value of the acquired firm that cannot be specifically identified and valued according to existing accounting standards.
The importance of intangibles has risen steadily over time as the market values of publicly traded firms are becoming increasingly driven by their investment in intangibles. In 1975, 83% of the market value of S&P 500 companies were related to the value of physical and financial assets. By 2015, the opposite had become true, with 84% of corporate value attributable to the value of unreported intangible assets (Business Intangibles 2015). This dramatic shift has necessitated a change in how companies manage their assets and evaluate investment decisions in an increasingly competitive business environment. Traditional financial statements, which primarily reflect tangible and financial assets, provide managers and investors with less than 20% of the information needed to evaluate future earnings of a company. This is grossly insufficient for effective decision-making.
Figure 1: Percentage of firm value attributable to intangibles

II. Literature Review
Many researchers have attempted to disaggregate intangibles and identify meaningful measures for them to determine each category’s influence on firm value creation. Wyatt (2008) gives a thorough review of the literature on intangibles through 2008, dividing the research into three main categories: technology resources, such as research and development and related intellectual properties, human resources, particularly human capital, and production resources, which can be further partitioned into advertising, customer loyalty, competitive advantage, and goodwill (Wyatt 2008; Lev et al. 2005; Kothari at al. 2002; Boone and Raman 2001; Hansson 2004; Abdel-khalik 2003; Rosett 2003; Ballester et al. 2002; List 2006; Kallapur and Kwan 2004; Gupta et al. 2004; Rajgopal et al. 2003; Henning et al. 2000). In addition, Wyatt (2008) identifies and evaluates five measurement techniques used in the literature: management-reported assets, researcher-estimated assets, annual expenditures, non-financial input metrics, such as number of scientists, and non-financial output metrics, such as number of patents.
Subsequent research on valuing intangibles has continued to evolve along these categories, with research on intangibles recently intersecting an equally long-standing body of research on the importance of Corporate Social Responsibility (CSR) as a driver of firm value. Malik (2005) provides a thorough examination of two decades of research on the value-enhancing impact of CSR on employees, customers, community, environment, regulators suppliers, and capital markets. As he points out, there is no specific definition of CSR, and the term is currently used interchangeably in reporting with sustainability or ESG, especially in the business press (Malik 2005). Recent research merges these two strands of the literature, considering ESG as a separate category of unreported intangibles (Yanagi and Michels-Kim 2018; Hsu et al. 2017). This integration of two avenues of research has just begun to develop, and it offers an opportunity to improve the existing body of research and extend the discussion to the public policy realm.
Corporations are increasingly emphasizing value creation for society as part of a long-term business strategy of value creation for the entity. Firms have responded to demands by various stakeholders—including investors, employees, consumers, communities, and regulators—to report on ESG activities, and by 2014, 75% of the S&P 500 firms voluntarily prepared sustainability reports (GAI 2014). By 2018, this number was up to 78% (Investor Responsibility Research Center 2018, 27). One of the drivers of this voluntary sustainability reporting is the recognition that sustainability-related issues can materially affect a company’s long-term performance (Shoaf et al. 2018).
At the same time, integrated reporting has emerged as a method for supporting a holistic approach to managing resources.
Integrated reporting is a concept that has been created to better articulate the broader range of measures that contribute to long-term value and the role organizations play in society. Central to this is the proposition that value is increasingly shaped by factors additional to financial performance, such as reliance on the environment, social reputation, human capital skills and others. This value creation concept is the backbone of integrated reporting and, we believe, is the direction for the future of corporate reporting. In addition to financial capital, integrated reporting examines five additional capitals [natural capital, social and relationship capital, intellectual capital, human capital, and manufactured capital] that should guide an organization’s decision-making and long-term success — its value creation in the broadest sense. (EY 2014, 1).
The International Integrated Reporting Council (IIRC) provides a framework for integrated reporting and thinking to guide organizations through the shift toward a reporting structure that recognizes the need for all resources, and the interdependencies among them, to be managed effectively in order to create long-term financial stability and sustainable development.[1] The usefulness of corporate financial statements for decision-making is limited to the extent that they do not reflect the true value of a company. Despite the fact that the majority of respondents to sustainability questions posed in the SEC’s April 2016 Concept Release supported mandating integrated sustainability reporting, no policy change has occurred in the U.S. to date (D’Aquila 2018). The EU, on the other hand, has issued Directive on the disclosure of non-financial and diversity information (Directive 2014/95/EU), which requires member states to adopt or adapt disclosure policies for ESG issues, with company compliance expected by 2018 (CSR Europe and GRI 2017, 5).
While the focus on sustainability reporting is timely and important, additional research is needed to understand the link between unrecorded intangible assets and firm value creation. The goal of our study is to contribute to the literature through an exploration of this relationship. Understanding how sustainability initiatives contribute to economic performance and social responsibility may help organizations to better manage investment in intangible assets to create value. It may also serve public policy in helping to encourage formalization and regulation of reporting on sustainability issues.
III. Sample Data
To investigate the link between economic performance and sustainability variables in creating value in corporations, we begin with an assessment of the roles played by intangibles. We base our analysis on the performance relationship broadly defined by researchers Gu and Lev, who established that economic performance is a function of investment in physical assets, financial assets, and intangible assets (Gu and Lev 2003). In order to investigate estimating economic performance as a function of physical, financial, and intangible assets, we ascertain the availability of relevant data. Physical assets are reported in the firm’s annual report, and collected in the Compustat database, as Property, Plant, and Equipment (ppent). Financial assets are generally computed as the sum of cash and short-term investments (che) and total current assets (act). Other useful firm data available in Compustat include market value, which is reported on most observations. When market value data is missing from Compustat, it can be computed as the product of the firm’s common shares outstanding (csho) and end-of-fiscal-year price (prcc_f).
We obtained data for the five-year period from 2012 through 2016 from Compustat’s annual corporate file. There are 57,184 observations, but incomplete data and other practical reasons required us to reduce the observations included in our analysis to 39,284. For example, 2,737 observations had to be excluded because Compustat shows the firms as having no physical or financial assets. Retaining observations that have positive values for both physical and financial assets reduces the observation frequency, by year, to those shown in column four of the chart below; the distribution of the initial 57,184 observations is given in columns two and three for comparison purposes. A chi-square test demonstrates that the initial and reduced data sets have a similar by-year distribution.

Specifications of data included and descriptive statistics for the data are shown in Table 1.
Table 1: Descriptive statistics[2]

IV. Research Design
Unrecorded intangible asset data analyzed in this study are grouped into the following basic categories: product/service value, including intellectual properties, innovation, and improved processes; customer value, such as brands and customer loyalty; employee value, which encompasses talent and human resource policies; social/relationship value, such as strategic alliances; and sustainability value, which captures ESG initiatives (Lev 2005; Yanagi and Michels-Kim 2017). Yanagi and Michels-Kim (2017) demonstrate the value of disaggregating intangibles into this last category, sustainability value, through an examination of a pharmaceuticals company in Japan.
In this study, economic performance is measured by either the firm’s market value (mkvalt), net income (ni), or its return on assets (ROA). Researchers Gu and Lev broadly identify the performance relationship as the following: Market Value = (α × Physical Assets) + (β × Financial Assets) + (γ × Intangible Assets) where α, β, and γ are the average weighted returns for each asset type (Gu and Lev 2003).
With measures for each asset type, we then construct a regression model to generate estimates of the relationships between each asset category and firm market value. This allows us to determine whether the hypothesized relationships between asset-types and performance are confirmed by the data. However, it is very difficult to find a reliable measure of intangible assets. We use two measures to estimate intangibles in our study: intangible asset value (Intangible-Assets) and returns on intangible assets (Intangible-Return).
Determining an Intangible Assets Measure
Our preferred approach is to estimate the value of intangible assets. As previously discussed, this is simply computed as the difference between a firm’s book value and market value. This method assumes that the book value excludes any measure of intangible assets, which suggests that intangible assets must account for any difference between the value of a firm reported on its balance sheet and the market value placed on a firm by investors as measured by stock price. However, to ensure consistency with the one-firm analysis of Gu and Lev, we also calculate the return on intangible assets using their two-step process. First, we regress market value on physical assets and financial assets. Second, we compute the residual as the return on intangible assets. Specifically:
Market_Value = (α × PhysicalAssets) + (β × FinancialAssets)
Intangible-Return = Market_Value – (α × PhysicalAssets + β × FinancialAssets)
This regression is shown in Table 2.
Table 2: Computation of the Intangible-Return Value[3]
Market_Value = (α × Physical Assets) + (β × Financial Assets)

Note that the regression suppresses the intercept so that all deviation is attributed to the error term; that error term will be used in Table 3 as the measure of (γ x Intangible-Assets) in a second-stage regression where:
Performance (NI, ROA) = f[(α x PhysicalAssets) + (β × FinancialAssets) + (γ × IntangibleAssets)]
Each variable is significant, and the explanatory power of the model, 55.71%, is good. Though heteroskedasticity is an issue, the White correction does not alter the significance evaluation of any coefficient.
We interpret the coefficients to indicate that the value of the firm is 32% higher than its physical asset value plus 69% of its financial assets and a mean-zero error. The coefficient estimates for PropPlantEquip (PhysicalAssets) and for FinancialAssets, α and β, were used to generate the unexplained portion of a firm’s market value, or Intangible-Return. Intangible-Return = MarketValue - (1.32283×PhysicalAssets + 0.69271×FinancialAssets).
The more straightforward method to isolate an aggregate value for intangible assets is to subtract the firm’s book value from the firm’s market values. In this study, the two intangible measurement approaches do not differ in effect. For consistency with the literature, the results related to the Gu-Lev approach are presented below, but we prefer the more straightforward approach to intangible measurement.
Evaluating the Three Asset Types
Using the measures computed for the intangible variables, the second-stage regression is computed to estimate the relationships between firm performance and the three asset categories—physical, financial, and intangible—to confirm that each asset-type has a significant impact on firm performance. The results of two regressions are shown in Table 3, where Panel A uses the Intangible-Return measure and Panel B uses the Intangible-Asset measure. In both cases, the results are strong and support the assumption that intangible assets influence earnings. The similarity of the measured intangible coefficient effects in the two models confirms a high correlation between the two approaches, validating our use of just one of the measures in the presentation of results.
Table 3a: Evaluating the Contribution of Assets to Performance[4]
Panel A: Performance Measured as Net Income
Performance (NI) = f[(α x PhysicalAssets) + (β x FinancialAssets) + (γ x IntangibleReturn)]

Table 3b: Evaluating the Contribution of Assets to Performance[5]
Panel B: Performance Measured as Return on Assets
Performance (ROA) = f[(α x PhysicalAssets) + (β x FinancialAssets) + (γ x IntangibleAssets)]
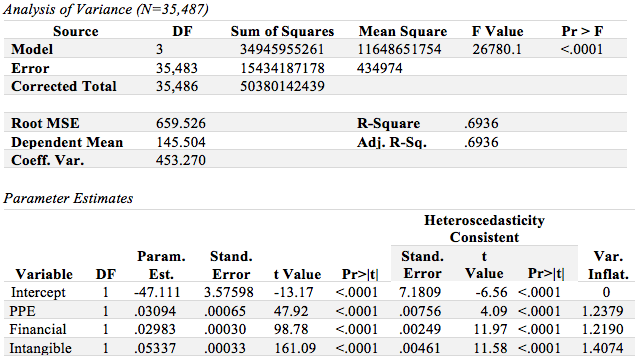
Again, the data show no evidence of multicollinearity (low variance inflation factors) or relevant heteroscedasticity. Although the standard errors are significantly different, the use of heteroscedasticity-consistent standard errors does not alter the conclusion that the coefficients are statistically significant.
Separating out Sustainability
The next step is to decompose the intangible asset measure into selected components representing a firm’s socially responsible activities. Yanagi and Michels-Kim (2017) hypothesize that environmental, social, and governance (ESG) activities primarily affect intangible assets, such as reputation. By incorporating a measure of ESG in our model, we assess its relative contribution to firm value. We disaggregate the intangibles variable into the three ESG components and an Unexplained-Other component.
Morgan Stanley Capital International’s (MSCI) ESG data, formerly referred to as Kinder, Lydenberg & Domini (KLD), are used to measure the social variables. While the data set has its limitations, the ESG measures provided by MSCI are frequently used by academics to estimate corporate social responsibility in companies, and researchers have demonstrated their validity (Chatterji et al. 2009; Kang 2015). KLD items are classified into three broad categories: environmental, governance, and social. The social category is further divided into five subcategories: community, diversity, employee relations, human rights, and product. Within each category and subcategory, items are characterized as strengths and concerns. Of the 72 items in the KLD dataset, only 23 have non-zero values in the database during the time studied.[6] We use the environmental, social, and governance indicator-level categories to represent the three social components of intangible assets because more complete information is available at a broader level.
Table 4 summarizes the frequency of information provided by KLD at the indicator level for environment and governance, and at the subcategory level for the five social indicator subsectors.
Table 4: Category-level KLD data frequency[7]

We use a principal component analysis (PCA) procedure to check for uniqueness of the social intangible data information. While factor combinations are possible, the PCA supports using the KLD social indicator-level data in further analysis. While the data can be reduced by creating and using a new factor variable rather than the four component variables, this is more about predictive efficiency than hypothesis testing. If one wants to know, for example, whether net income is a function of employee relation strengths, the use of the factor will not be useful. Similarly, the indicator-level variables always mask the underlying granular cause.
To create the Unexplained-Intangible measure, we employ a two-step process similar to that used in Table 2 to compute the value of the Intangible-Return variable. Using the intangible asset measures developed earlier in Table 3, we compute the relationship between intangible assets and the indicator-level KLD strength and concern variables, shown in Table 5, and then compute the residual, which is identified as the Unexplained-Intangible measure.
Table 5a: Computation of the Unexplained-Intangible Value[8]
Panel A: Computation of the Unexplained-Intangible Value as the Residual Using IntangibleReturn as the Dependent Variable
IntangibleReturn = (α × Strengths) + (β × Concerns)

Table 5b: Computation of the Unexplained-Intangible Value (continued)[9]
Panel B: Computation of the Unexplained-Intangible-Assets Value as the Residual Using IntangibleAssets as the Dependent Variable
IntangibleAssets = (α × Strengths) + (β × Concerns)

Two variables are computed from this output, Unexplained-Intangible-Return and Unexplained-Intangible-Assets, using the following equations:
Unexplained-Intangible-Return = IntangibleReturn – (767.30655 × Strengths + 1756.92455 × Concerns);
and
Unexplained-Intangible-Assets = IntangibleAssets – (919.48370 × Strengths + 2343.49393 × Concerns)
This computed measure is used in a second-stage regression in which net income is considered a function of PhysicalAssets, FinancialAssets, Unexplained-Intangible assets[10], the KLD Strengths and Concerns, and a set of control variables.
Evaluating the Importance of ESG Intangibles
Variable measures as described thus far were used in a set of regressions that test our main hypotheses that income is a function, in part, of the environmental, social, and governance components of intangible assets. The full regressions, which differ by the measures used for Unexplained-Intangibles (R for return or A for assets), are as follows:
NI = f(Property Assets, Financial Assets, Identified-Intangibles, Unexplained-Intangibles-R, Controls
NI = f(Property Assets, Financial Assets, Identified-Intangibles, Unexplained-Intangibles-A, Controls)
Based on prior research, we include size, liquidity, and leverage as control variables in our models. We evaluated our models both with and without control restrictions. An F-test demonstrated that the unrestricted model is not statistically equivalent to the restricted model; hence, we report only the results from the models that include the control variables.
According to Mertens et al. (2017), “researchers focus only on the observable omitted correlated variable that can be included in the model, whereas extant theory dictates which variables should be taken into account” (106). This paper addresses the observable omitted correlated variables via a set of control variables that are determined using extant theory.
Following the rationale described by Barrese, Pooser, and Walker (2018), we included their measures of the accepted controls that can affect models of corporate performance, namely corporate size (Marcus, 1969), liquidity (Holmström and Tirole, 1993), and leverage (Opler and Titman, 1994). To measure size, we use the natural log of the firm’s book value of assets. The ratio of cash and short-term equities to the book value of assets is used to measure liquidity. Leverage is measured by the debt-to-equity ratio.
V. Results
We test our models with the data collected and computed as described above. Although predictive power varies with the performance measure used, our results for all three asset types are robust. The return to physical, financial, and intangible assets is positive. Given the lack of significant difference in the results, we use the simpler measure of intangible assets, or the difference between an organization’s market value and book value, for the regressions.
Table 6 reports the results of the net income regressions. In Table 6, Panel A employs the model with Unexplained-Intangibles-Return and Panel B uses Unexplained-Intangibles-Assets, as they are developed in Table 5, Panels A and B.
Table 6a: Regression of Assets and ESG Indicators on Net Income[11]
Panel A: Regression of Assets and ESG Indicators on Net Income Using Unexplained-Intangibles-Return
Net Income = PhysicalAssets + FinancialAssets + ESG Strengths + ESG Concerns + Unexplained-Intangibles-Return + Controls (Leverage + Liquidity + FirmSize)
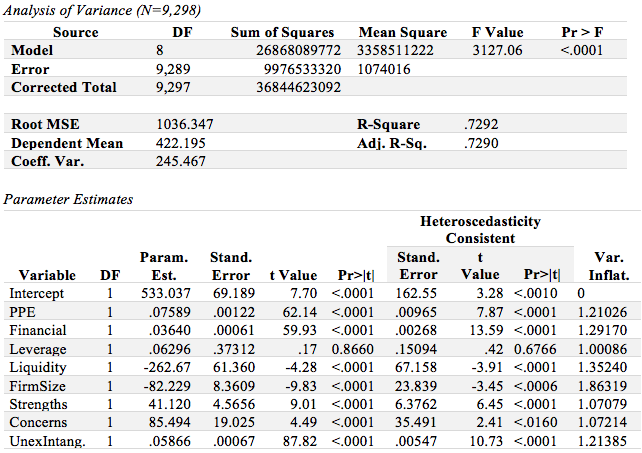
Table 6b: Regression of Assets and ESG Indicators on Net Income (continued)[12]
Panel B: Regression of Assets and ESG Indicators on Net Income Using Unexplained-Intangibles-Asset
Net Income = PhysicalAssets + FinancialAssets + ESG Strengths + ESG Concerns + Unexplained-Intangibles-Asset + Controls (Leverage + Liquidity + FirmSize)

Results reveal that all predictor variables and control variables in the model are statistically significant (p<.0001) except for the leverage variable. In relation to net income, each independent variable of interest is positive, suggesting that each contributes to earnings. Parameter estimates of the ESG Strengths and Concerns variables suggest that these variables contribute substantially to firm earnings. The models are statistically significant (p<.0001), with an explanatory power of 72.9%. Results are consistent regardless of whether the return or assets variable is used to measure unexplained intangibles.
Table 7 shows a comparison of restricted and unrestricted regression specifications for the models focusing on the asset approach. The columns identified as a base model relate net income to the various asset types and to a set of control variables, including firm size, leverage, and liquidity.
Table 7: Net Income Models with Disaggregation of Intangibles

Model I replaces intangible assets with a computed “unexplained” portion, the residual of a regression of intangible assets onto the KLD strength and concern variables. The KLD Strength and Concern variables are added to the Unexplained Intangible asset portion in Model I. Except for one of the control variables, leverage, all variables are significant. The estimated positive sign for concerns, however, requires investigation.
Model II breaks strengths and concerns into the indicator-level variables for environment and governance as well as to the sub-indicator level for social indicators. Consistent with that findings from Model I, environmental, diversity and employee relation strengths are each positive in Model II. The concern variable is also positive in Model I, suggesting that net income increases with greater social concerns about the firm’s activities. The breakdown, in Model II, is driven by positive coefficients for environmental concerns and governance concerns; no other social influence variable is significant. The environmental result is consistent with our expectations that a firm whose activities elicit greater concern over its impact to the environment would be incurring lower costs and thus earning a higher net income. The positive coefficient on governance concerns is less easy to understand, but we suspect that it may be attributable to the lack of clear governance-performance relationships. For example, many would consider a firm’s decision to link its strategic and managerial leadership through tapping one individual to occupy both roles[13] a poor governance situation (Rechner and Dalton 1991). However, most find the situation to be insignificant (Elsayed 2007; Tang 2017). If KLD counts duality as a governance concern, the expectation of a negative effect is reduced. The duality argument does not answer the question of why the governance concern effect is a positive, but it highlights the need for a better understanding of the assumptions in the social indicator data.
While the adjusted R-squared for Models I and II are similar, Model II provides more granular data on the relationship of specific ESG indicators. Model II is thus more helpful to analysis of alternative investments in social intangible assets.
This study demonstrates the importance of considering intangible assets in evaluations of firm performance. Although our research shows that intangibles are a significant predictor of performance, the paucity of existing measures for some components of intangible assets has led most empirical research to ignore their impact. Some differences in the physical assets held by firms do not generate significant differences between the performance of those firms, but a large body of research considers those differences. For example, multiple studies of corporate performance consider differences in size, leverage, liquidity, industry, competition, production efficiency, and risk. Some of the factors considered may have impacts on both tangible and intangible asset values, but the literature is nearly always focused on the tangible issues. The results of this study serve as a call for more attention to intangible asset measurement and the need to develop public policies that improve the availability and quality of reporting on the financial and nonfinancial impact of intangibles.
VI. Conclusion
The increasing importance of unrecorded intangibles as drivers of market value for publicly-held firms, combined with the widespread public interest in sustainability reporting, make this study both timely and significant. In this paper, we focus on disaggregating ESG measures from other intangibles and then assessing their contribution to firm value. Research is just now beginning to develop at the intersection of sustainability value assessments, such as those related to CSR or ESG initiatives, and evaluations of all unrecorded intangible assets, which now comprise well over 80% of firm value. This study contributes to that promising research.
Results of this analysis suggest that a firm’s ESG activities, as measured by KLD indicators, comprise a significant part of the unrecorded intangible assets that create value in the marketplace. Based on the regressions, it appears likely that a firm’s investment in ESG activities has an impact on its economic performance. Future research might further disaggregate ESG initiatives into more granular categories and assess their relative importance to firm value.
Sustainability reporting has been mandated in the EU, and a significant portion of U.S. corporations report voluntarily. Recent public acknowledgement of the need for information about unreported ESG activities has significant implications for public policy. Schreck and Raithel (2018) show that voluntary reporting of sustainability activities has different motivations and may not accurately signal the marketplace about sustainability activities. Ioannou and Serafeim (2012) demonstrate that the political system is the primary factor in differentiating corporate social performance among countries. They conclude, as they did in an earlier paper published in 2011, that public policy is significant in shaping corporate social performance and that mandatory corporate sustainability reporting enhances corporate social performance (Ioannou and Serafeim 2012). If mandatory sustainability disclosures align reporting with actual activities while simultaneously improving firms’ performance on sustainability issues, as implied by existing research, then significant benefits should accrue to the general public. Further research on this topic will likely be needed to yield improvements in public policy.
Despite growing public interest and widespread voluntary reporting by larger firms, U.S. policymakers have been hesitant to implement mandatory reporting of ESG activities. Nonetheless, the American Institute of Certified Public Accountants (AICPA) issued Attestation Engagements on Sustainability Information (including Greenhouse Gas Emissions Information) in July 2017 to provide CPAs with guidance on conducting assurance audits for integrated ESG reporting or stand-alone ESG reports. AICPA’s actions suggest that there is increased demand for external validation of voluntary sustainability reports. Rising public demand for sustainability reporting may ultimately provide an impetus for shaping public policy in this area.
+ Author biographies
Cynthia R. Phillips, Ed.D., CPA, is an associate professor in the Department of Accountancy in the Peter J. Tobin College of Business, St. John’s University and Director of the University’s Center for Teaching and Learning. Dr. Phillips holds an Ed.D., Instructional Leadership and M.B.A., Finance from St. John’s University, and B.B.A., Accounting from Hofstra University. Dr. Phillips has numerous conference presentations and has published in Journal of Public Budgeting, Accounting and Financial Management, Journal of Business and Educational Leadership, CPA Journal, and the Review of Business. Prior to joining St. John’s, Dr. Phillips held several accounting positions in the investment banking industry.
Victoria Shoaf, Ph.D., CPA, is a professor in the Department of Accountancy at the Peter J. Tobin College of Business at St. John’s University. She holds a Ph.D. in Business (Accounting) from Baruch College of the City University of New York. She has published in such peer-reviewed journals as the Journal of Business Ethics, the International Business and Economics Research Journal, the Journal of Applied Business Research, the Journal of Accounting and Finance Research, and the Review of Business, and she has published three book chapters. Prior to joining St. John’s, she held several leadership positions in industry. She is an active member of the American Accounting Association, and she is currently on the Board of the Queens-Brooklyn Chapter of the New York State Society of CPAs.
+ Footnotes
[1] See the International Integrated Reporting Council’s webpage at http://integratedreporting.org/the-iirc-2/.
[2] The data, drawn from Compustat, include: Net Income (NI); Market value (MKVALT); Physical Assets: Property, Plant, & Equipment (PPENT); Financial Assets: Cash and Short-term investments (CHE) plus Total Current Assets (ACT); Leverage: the ratio of Long-term debt (DLTT) plus debt in current liabilities (DLC) to shareholder equity (SEQ); Liquidity: the ratio of Cash and Short-term investments (CHE) to Total Assets (AT); Firm Size: the log of total Assets (AT); Intangible Assets: the difference between market value and book value.
[3] Market_Value: Market value (MKVALT in Compustat). Physical Assets or PPE: Property, Plant, & Equipment (PPENT in Compustat). Financial Assets or Financial: Cash and Short-term investments (CHE in Compustat) plus Total Current Assets (ACT in Compustat).
[4] Performance (NI): Net Income (NI in Compustat). PhysicalAssets or PPE: Property, Plant, & Equipment (PPENT in Compustat). FinancialAssets or Financial: Cash and Short-term investments (CHE in Compustat) plus Total Current Assets (ACT in Compustat). IntangibleReturn or Intangible: Intangible Assets as valued in Table 2.
[5] Performance (ROA): Return on Assets (ROA in Compustat). PhysicalAssets or PPE: Property, Plant, & Equipment (PPENT in Compustat). FinancialAssets or Financial: Cash and Short-term investments (CHE in Compustat) plus Total Current Assets (ACT in Compustat). IntangibleAssets or Intangible: Intangible Assets as valued in Table 2.
[6] A complete listing of KLD categories used is given in the Appendix.
[7] See appendix for details on KLD categories.
[8] IntangibleReturn: as computed in Table 3 Panel A above. Strengths: KLD indicators as summarized in Table 4 and detailed in the Appendix. Concerns: KLD indicators as summarized in Table 4 and detailed in the Appendix.
[9] Intangible Assets: as computed in Table 3 Panel B above. Strengths: KLD indicators as summarized in Table 4 and detailed in the Appendix. Concerns: KLD indicators as summarized in Table 4 and detailed in the Appendix.
[10] The portion not accounted for by the ESG strength and concern measures comprises Unexplained-Intangible assets.
[11] Net Income: NI in Compustat.PhysicalAssets or PPE: Property, Plant, & Equipment (PPENT in Compustat). FinancialAssets or Financial: Cash and Short-term investments (CHE in Compustat) plus Total Current Assets (ACT in Compustat). Leverage: debt-to-equity ratio ([DLTT+DLC]/SEQ in Compustat). Liquidity: the ratio of Cash and Short-term investments (CHE in Compustat) to book value of assets (AT in Compustat). FirmSize: the natural log of the firm’s book value of assets. Strengths: KLD indicators as summarized in Table 4 and detailed in the Appendix. Concerns: KLD indicators as summarized in Table 4 and detailed in the Appendix. Unexplained-Intangibles-Return or UnexIntang.: Unexplained Intangibles calculated in Table 5 Panel A.
[12] Net Income: NI in Compustat. PhysicalAssets or PPE: Property, Plant, & Equipment (PPENT in Compustat). FinancialAssets or Financial: Cash and Short-term investments (CHE in Compustat) plus Total Current Assets (ACT in Compustat). Leverage: debt-to-equity ratio ([DLTT+DLC]/SEQ in Compustat). Liquidity: the ratio of Cash and Short-term investments (CHE in Compustat) to book value of assets (AT in Compustat). FirmSize: the natural log of the firm’s book value of assets. Strengths: KLD indicators as summarized in Table 4 and detailed in the Appendix. Concerns: KLD indicators as summarized in Table 4 and detailed in the Appendix. Unexplained-Intangibles-Asset or UnexIntang.: Unexplained Intangibles calculated in Table 5 Panel B.
[13] This is often described in the literature as a duality.
+ References
Abdel-khalik, A. Rashad. 2003. “Self-Sorting, Incentive Compensation, and Human-Capital Assets.” The Accounting Review 12 (4): 661-697.
Aboody, David and Baruch Lev. 1998. “The Value Relevance of Intangibles: The Case of Software Capitalisation.” Journal of Accounting Research 36, Supplement (1998): 161-191.
Amir, Eli, Yanling Guan, and Gilad Livne. 2007. “The Association of R&D and Capital Expenditures with Subsequent Earnings Variability.” Journal of Business, Finance & Accounting 34 (1 and 2): 222-246.
Ballester, Marta, Joshua Livnat, and Nishi Sinha. 2002. “Tracks.” Journal of Accounting, Auditing & Finance 17 (4): 351-373.
Barrese, James, David Pooser, and Paul Walker. 2018. “The Value Relevance of Proxy Disclosure Enhancements: An Analysis of Risk Management and Board Risk Oversight Disclosures.” Working paper submitted to the Asia-Pacific Conference on International Accounting Issues.
Barth, Mary and Greg Clinch. 1998. “Revalued Financial, Tangible, and Intangible Assets: Association with Share Prices and Non-Market-Based Value Estimates.” Journal of Accounting Research 36 (Supplement 1998): 199-233.
Boone, Jeff P. and K. K. Raman. 2001. “Off-Balance Sheet R&D Assets and Market Liquidity.” Journal of Accounting and Public Policy 20 (2): 97-128.
Business Intangibles, LLC. 2015. “Intangible Assets Increase to 84% of the S&P 500's Value in 2015 Report.” http://www.businessintangibles.com/single-post/2015/03/11/Intangible-Assets-Increase-to-84-of-the-SP-500s-Value-in-2015-Report.
Chatterji, Aaron K., David I. Levine, and Michael W. Toffel. 2009. “How Well Do Social Ratings Actually Measure Corporate Social Responsibility?” Journal of Economics & Management Strategy 18 (1): 125-169.
Cheng, Qiang. 2005. “What Determines Residual Income?” The Accounting Review 80 (1): 85-112.
Cokins, Gary and Nick Shepherd. 2017. “The Power of Intangibles: We Need to Move Beyond the Narrow Breadth of Current Financial Accounting and Reporting and Shift to Value Creation.” Strategic Finance 98 (11): 32-39.
CSR Europe and GRI. 2017. Member State Implementation of Directive 2014/95/EU. https://www.globalreporting.org/resourcelibrary/NFRpublication%20online_version.pdf.
D’Aquila, Jill M. 2018. “The Current State of Sustainability Reporting: A Work in Progress.” The CPA Journal 88 (7): 44-50.
Darrough, Masako, Heedong Kim, and Emanuel Zur. 2019. “The Impact of Corporate Welfare Policy on Firm-Level Productivity: Evidence from Unemployment Insurance.” Journal of Business Ethics 159 (3): 795-815.
Elsayed, Khaled. 2007. “Does CEO Duality Really Affect Corporate Performance?” Corporate Governance: An International Review 15 (6): 1203-1214.
EY. 2014. Integrated Reporting: Elevating Value. EY Climate Change and Sustainability Services. Available athttp://www.ey.com/Publication/vwLUAssets/EY-Integrated-reporting/$FILE/EY-Integrated-reporting.pdf.
Gu, Feng and Baruch Lev. 2003. “Intangible Assets: Measurements, Drivers, Usefulness.” Working paper #2003-05, Boston University School of Management, 2003. https://pdfs.semanticscholar.org/4d25/211f5ce58a92e9be781eebfd591ecae38985.pdf.
Gu, Feng and Baruch Lev. 2017. “Time to Change Your Investment Model.” Financial Analysts Journal 73 (4): 23-33.
Gupta, Sunil, Donald R. Lehman, and Jennifer Ames Stuart. 2004. “Valuing Customers.” Journal of Marketing Research 41 (1): 7–18.
Hansson, Bo. 2004. “Human Capital and Stock Returns: Is the Value Premium an Approximation for Return on Human Capital?” Journal of Business, Finance & Accounting 31 (3-4): 333-358.
Henning, Steven L., Barry L. Lewis, and Wayne H. Shaw. 2000. “Valuation of the Components of Purchased Goodwill.” Journal of Accounting Research 38 (2): 375-386.
Holmström, Bengt and Jean Tirole. 1993. “Market Liquidity and Performance Monitoring.” Journal of Political Economy 101 (4): 678-709.
Hsu, Audrey, Kevin Koh, Sophia Liu, and Yen H. Tong. 2019. “Corporate Social Responsibility and Corporate Disclosures: An Investigation of Investors’ and Analysts’ Perceptions.” Journal of Business Ethics 158 (2): 507-534. https://doi.org/10.1007/s10551-017-3767-0.
International Integrated Reporting Council (IIRC). n.d. Available at: https://integratedreporting.org/.
Investor Responsibility Research Council (IRRC). 2018. “State of Sustainability and Integrated Reporting 2018.” Investor Responsibility Research Center Institute (IRRCI). Available at https://www.weinberg.udel.edu/IIRCiResearchDocuments/2018/11/2018-SP-500-Integrated-Reporting-FINAL-November-2018-1.pdf.
Kallapur, Sanjay and Sabrina Y. S. Kwan. 2004. “The Value Relevance and Reliability of Brand Assets Recognized by U.K. Firms.” The Accounting Review 79 (1): 151-172.
Kang, Jingoo. 2015. “Effectiveness of the KLD Social Ratings as a Measure of Workforce Diversity and Corporate Governance.” Business & Society 54 (5): 599-631.
Kothari, S. P., Ted E. Laguerre, and Andrew J. Leone. 2002. “Capitalization versus Expensing: Evidence on the Uncertainty of Future Earnings from Capital Expenditures versus R&D Outlays.” Review of Accounting Studies 7 (4): 355-382.
Landsman, Wayne. 1986. “An Empirical Investigation of Pension Fund Property Rights.” The Accounting Review 61 (4): 662-691.
Lev, Baruch. 2004. “Intangible Assets: Concepts and Measurements.” In Encyclopedia of Social Measurement, vol. 2, edited by Kimberly Kempf-Leonard. Elsevier.
———, Lev, Baruch, Bharat Sarath, and Theodore Sougiannis. 2005. “R&D Reporting Biases and Their Consequences.” Contemporary Accounting Research 22 (4): 977-1026.
List, John A. 2006. “The Behavioralist Meets the Market: Measuring Social Preferences and Reputation Effects in Actual Transactions.” Journal of Political Economy 114 (1): 1-37.
Malik, Mahfuja. 2015. “Value-Enhancing Capabilities of CSR: A Brief Review of Contemporary Literature.” Journal of Business Ethics 127 (2): 419-438.
Marcus, Matityahu. 1969. “Profitability and Size of Firm: Some Further Evidence.” The Review of Economics and Statistics 51 (1): 104-107.
Mertens, William, Amedeao Pugliese, and Jan Recker. 2017. Quantitative Data Analysis: A Companion for Accounting and Information Systems Research. Switzerland: Springer. ISBN 978-3-319-42699-0 DOI 10.1007/978-3-319-42700-3.
Moeller, Klaus. 2009. “Intangible and Financial Performance: Causes and Effects.” Journal of Intellectual Capital 10 (2): 224-245. https://doi.org/10.1108/14691930910952632.
Nickell, Stephen J. 1996. “Competition and Corporate Performance.” Journal of Political Economy 104 (4): 724-746.
Opler, Tim C. and Sheridan Titman. 1994. “Financial Distress and Corporate Performance.” Journal of Finance 49 (3): 1015-1040.
Rajgopal, Shivaram, Mohan Venkatachalam, and Suresh Kotha. 2003. “The Value-Relevance of Network Advantages: The Case of E-Commerce Firms.” Journal of Accounting Research 41 (1): 135-162.
Rechner, Paula L. and Dan R. Dalton. 1991. “CEO Duality and Organizational Performance: A Longitudinal Analysis.” Strategic Management Journal 12 (2): 155-160.
Rosett, Joshua G. 2003. “Labour Leverage, Equity Risk and Corporate Policy Choice.” European Accounting Review 12 (4): 699-732.
Shleifer, Andrei and Robert W. Vishny. 1997. “A Survey of Corporate Governance.” The Journal of Finance 52 (2): 737-783.
Securities and Exchange Commission (SEC). 2016. Release No. 33-10064; 34-77599; “Business and Financial Disclosure Required by Regulation S-K.” Available at: https://www.sec.gov/rules/concept/2016/33-10064.pdf.
Shoaf, Victoria, Eva Jermakowicz, and Barry Epstein. 2018. “Towards Sustainability and Integrated Reporting: Recent Developments.” Review of Business 38 (1): 1-15.
Schreck, Philipp and Sasccha Raithel. 2018. “Corporate Social Performance, Firm Size and Organizational Visibility: Distinct and Joint Effects on Voluntary Sustainability Reporting.” Business & Society 57 (4): 742-778.
Tang, Jianyun. 2017. “CEO Duality and Firm Performance: The Moderating Roles of Other Executives and Blockholding Outside Directors.” European Management Journal 35 (3): 362-372.
Wyatt, Anne. 2008. “What Financial and Non-Financial Information on Intangibles is Value Relevant? A Review of the Evidence.” Accounting and Business Research 38 (3): 217-256.
Yanagi, Ryohei and Nina Michels-Kim. 2018. “Integrating Nonfinancials to Create Value.” Strategic Finance 99 (7): 26-35.