The Georgetown Public Policy Review

WHEN UBER COMES TO TOWN:THE IMPACT OF TRANSPORTATION NETWORK COMPANIES ON METROPOLITAN LABOR MARKETS

Kathryn Michael Zickuhr

Abstract: The rise of Transportation Network Companies (TNCs) such as Uber and Lyft have led to many questions about these companies’ effects on both the taxi industry and larger patterns of nonstandard work arrangements. This study uses multiple regression analysis to explore the association between the presence of TNCs and taxi driver employment based on information about when TNCs expanded into specific Metropolitan Statistical Areas and data from the Current Population Survey. This study did not find evidence that transportation network companies such as Uber and Lyft have yet had a significant impact on taxi employment in the metropolitan areas in which they operate.


IMG_0106.JPG

I. INTRODUCTION

The past five years have seen a marked rise in the number of companies that are part of “gig economy.” These include Transportation Network Companies (TNCs) like Uber and Lyft, as well as other labor-based services like Instacart, Rover, and Handy.[i] These companies distinguish themselves from the traditional business models of their respective industries by using technology to coordinate “peer-to-peer” models of on-demand services, connecting service providers directly with customers in as seamless a manner as possible through the service’s mobile app or website. For most of these companies, workers are not considered employees, but are instead designated as independent contractors. While some platforms, like Instacart (Alba 2015) and Managed by Q (Davidson 2016), hire workers as employees, the use of independent contracting is widespread because it shifts the risk and costs onto the worker, allowing the company to scale up quickly without large payrolls or benefits on its balance sheet. Proponents say these contracting-based companies are a more efficient way to match supply with demand, potentially reducing slack in the labor market; critics say they flout existing labor regulations and leave workers without the benefits and protections required by law.

Uber has been the most visible of these online labor platforms, and its rapid expansion and massive disruption of the taxi industry has driven much of the policy conversation thus far.

Uber has been the most visible of these online labor platforms (Harris and Krueger, 2015), and its rapid expansion and massive disruption of the taxi industry has driven much of the policy conversation thus far.[ii] The proliferation of the “Uber for ___” business model has resulted in increased attention as to whether TNC drivers are truly self-employed entrepreneurs as their independent contractors categorization suggests, or whether they function more like traditional employees (Rosenblatt 2015, Griswold 2015, Wingfield and Isaac 2015). It has been suggested that these types of arrangements are best described as a third type of worker category, “dependent contractors” (Harris and Krueger 2015), though others argue that these companies are just continuing traditional business trends of worker misclassification (Sachs 2015). Ultimately, the use—and potential misclassification—of independent contractors is not unique to the emerging gig economy, and has been widespread in sectors such as construction and health services (Katz and Krueger 2016); in fact, a large proportion of licensed taxi drivers have already been functioning as independent contractors in many cities for decades (Gilbert and Samuels 1982, Hodges 2009). However, the popularity of TNCs and other online labor platforms are bringing increased attention to the use of independent contractors and the seeming proliferation of “gig” work, both at these companies and more broadly.

However, the popularity of TNCs and other online labor platforms are bringing increased attention to the use of independent contractors and the seeming proliferation of “gig” work, both at these companies and more broadly.

As researchers and policymakers grapple with the questions raised by the rise of Uber and online labor platforms, one of the biggest challenges has been the lack of publicly-available data about the size, scope, and impact of these potentially new types of workers, as well as how they fit in with overall workforce trends. This paper contributes to the literature by studying the effects of TNCs—and the gig economy more broadly—on workers in metropolitan areas. It also examines the effect of TNCs on the taxi labor market. I use the Census Bureau’s Current Population Survey (CPS) to study whether the presence of TNCs in U.S. metropolitan statistical areas (MSAs) is associated with a decrease in taxi driver employment.

II. LITERATURE REVIEW

The rise of Transportation Network Companies

Uber launched in 2010 as UberCab, but it initially only facilitated on-demand access to private black cars driven by professionally licensed drivers (Wortham 2011); at the time of its NYC launch in 2011, CNET described it as “a limousine-booking start-up” (McCarthy 2011). At this stage, Uber was not directly competing with existing private car services so much as connecting existing black car and limo drivers with passengers during off-peak hours (Malik 2011, Graham 2011). By mid-2012, however, Uber had launched its lower-priced UberX service, which does not require that a driver be professionally licensed or have a specific type of car, just as competitors Lyft and Sidecar were launching their own “peer-to-peer” ride-sharing services in San Francisco (Lawlor 2012, Gannes 2012).

While there are many TNC start-ups, Uber is the dominant service in the United States (Hawkins 2015, Harris and Krueger 2015). Most of the quantitative insights into TNC labor markets have also been focused on Uber, particularly UberX, which we will assume is similar in dynamics to competitors such as Lyft and Sidecar.[iii]  A paper co-written by Jonathan Hall, Uber’s head of policy research, and economist Alan Krueger is the most direct information available on Uber’s drivers (2015).[iv] It also compares the characteristics of Uber drivers to American Community Survey (ACS) data on taxi drivers and chauffeurs from a similar time period. It shows that the number of Uber drivers began growing at an increasing rate after the launch of UberX, resulting in over 160,000 active Uber drivers in the U.S. by the end of 2014 (Hall and Krueger 2015).[v]

Since 2014, Uber has also repeatedly cut base rates on its UberX service to encourage more ridership, which it says has resulted in more take-home pay for drivers, and launched the lower-cost car-pooling service UberPOOL (Feuer 2016). By the end of 2015, the number of active drivers for Uber and Lyft combined totaled almost 500,000—roughly the same as the number of taxi drivers and chauffeurs nationally, according to CPS estimates (Cramer and Krueger 2015).

The impact of TNCs on the taxi industry

The taxi industry is no stranger to changes and disruptions. One major change was the shift in working arrangements in the late 1970s and early 1980s, which saw the taxi industry largely shift from employer-employee relationships to independent contracting (leasing arrangements and “owner-drivers”) (Gilbert and Samuels 1982, Biju 2005). This led to increasing turnover among drivers, and coincided with a major shift in driver demographics as new immigrants replaced U.S.-born drivers (Hodges 2009). Since 1980, taxi driver demographics have continued to change (see Appendix: Table 6). In many ways, these trends mirror larger changes in the U.S. workforce, such as an aging population, rising levels of education, and increasing racial and ethnic diversity (Toosi 2002, 2013).

TNCs, with their frictionless dispatching algorithms, seamless payment systems, responsiveness to demand, and use of customer and driver rating systems, have proved a major challenge to the traditional taxi industry.

The latest disruption to the taxi industry has been the rise of TNCs since the early 2010s. There are many reasons TNCs have proven to be so popular, most notably the superior convenience, customer experience, and a prevalence of lower fares compared to that of traditional taxicabs. Taxis have traditionally been highly regulated, largely at the local level, for a variety of reasons related to transportation policy, public safety, and rent-seeking (Gilbert and Samuels 1982, Hodges 2009). As a result, prices are generally fixed, and regulatory barriers to entry often high. In addition, the logistics of street hails, combined with the high number of operators in larger markets, make it difficult for passengers to make choices based on quality (Wallsten 2015). TNCs, with their frictionless dispatching algorithms, seamless payment systems, responsiveness to demand, and use of customer and driver rating systems, have proved a major challenge to the traditional taxi industry.

Present evidence suggests that TNCs are expanding the market for car services in some areas by attracting new clients to on-demand car services, but they are also competing with taxis directly for taxis’ core business. For instance, FiveThirtyEight analyzed data from New York City and found that rides starting in outer boroughs made up a higher proportion of Uber trips than taxi trips in 2014. However, it also found that that Uber and taxi pickup patterns are fairly similar, and that yellow cab pick-ups are down even as the total number of for-hire car pickups increased from 2014 to 2015[vi] (Fischer-Baum and Bialik 2015).

While the exact effects of TNCs remain unknown, it is clear that taxi companies in many major cities have been under increasing stress in recent years. In New York City, taxi medallion prices had increased quickly over the course of the 2000s, peaking in June 2013. However, they have now fallen 28% from that peak (Barro 2015). The NYC Taxi and Limousine Commission estimates that drivers in 2012 earned an average of $130 a day, down from $150 in 2006—a reduction of almost 25% when adjusted for inflation (Grynbaum 2012). And since 2012, the number of taxi trips in New York City has decreased by 8% (Wallsten 2015). Taxis have seen declining revenues in other cities well. In Seattle, the addition of as many as 5,000 TNC drivers since 2013 resulted in a 28% decrease in taxi company revenues (Soper 2015). Taxi markets in Boston, Chicago, and Philadelphia have seen similar trends (Madhani 2015).

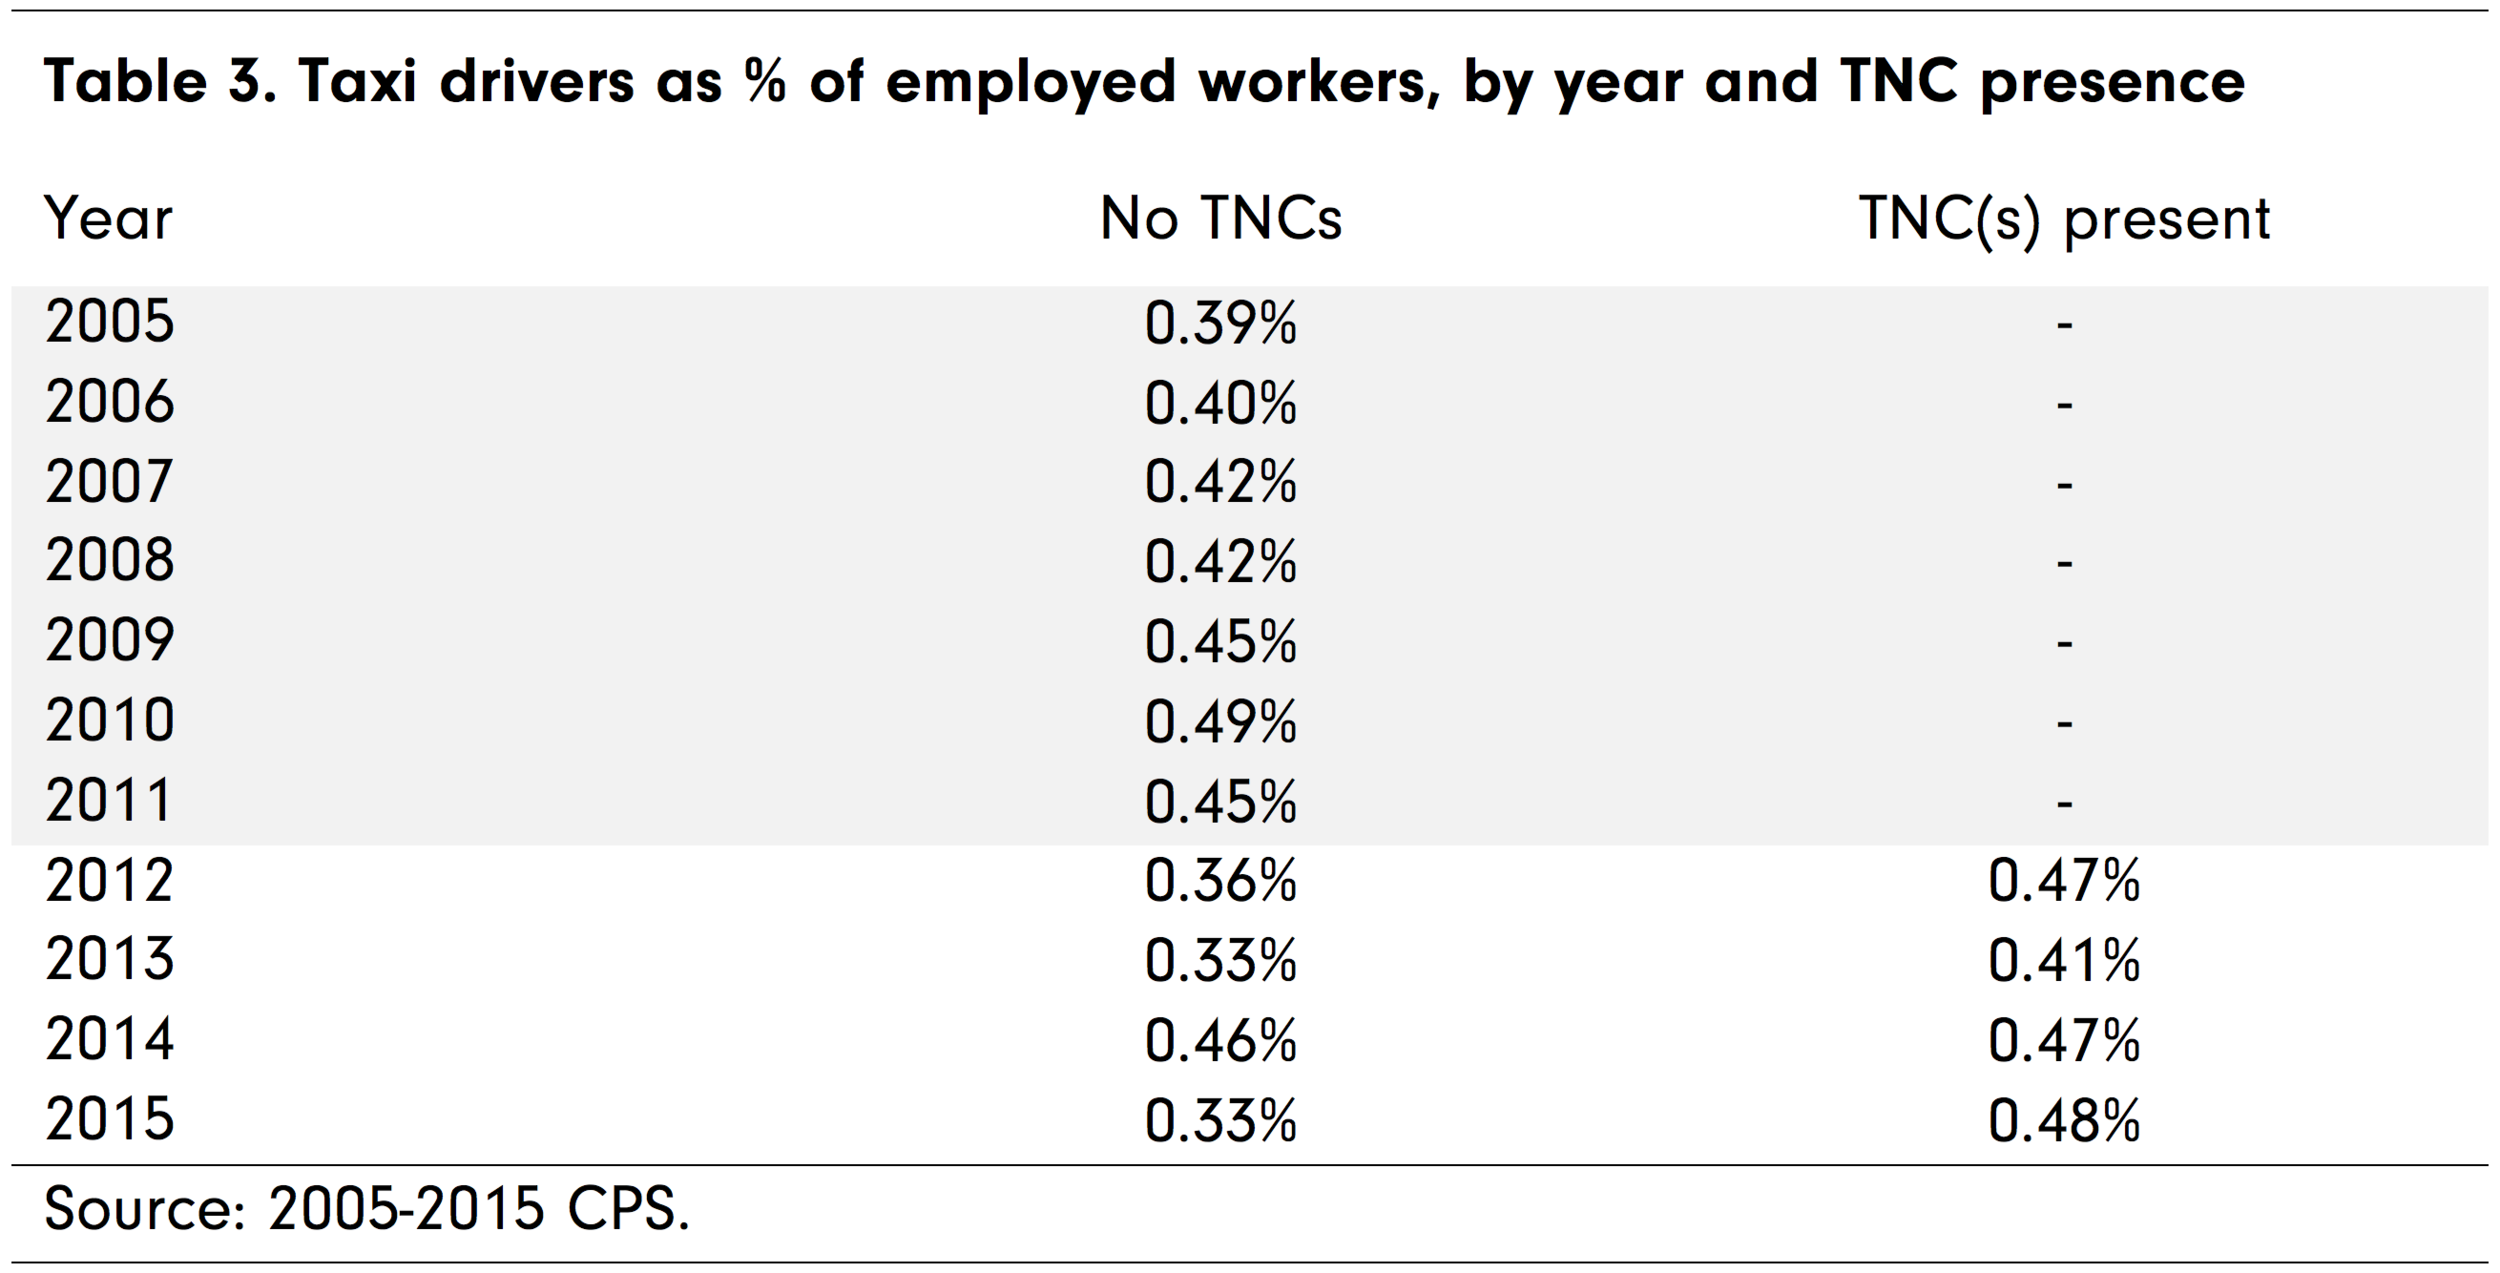
However, it remains unclear how overall taxi driver employment has been affected by the rise of TNCs. As of October 2015, there were 52,612 medallion drivers licensed to drive yellow cabs in New York City, down 2.2 percent from the end of 2014 (Fischer-Baum and Bialik 2015), although analysis of CPS data shows that nationally, the proportion of taxi drivers and chauffeurs in the workforce returned to its 2010 levels by 2015 (Figure 1).

Independent contractors and the sharing economy

Independent contracting and alternative work arrangements are far from new; research over the past 20-30 years has looked at the rise of the use of contracting by firms and the characteristics of workers who are employed as regular employees compared with those who are retained as independent contractors (Davis-Blake and Uzzi 1993, Bidwell and Briscoe 2009).

One way to examine the changing labor landscape is through the rise of “contingent workers.” Reviews of the data landscape by Annette Bernhardt (2014) and the U.S. Government Accountability Office (2015) have already identified the main sources of data available, the definitions of contingent work commonly used in academic and policy discussions, and the main gaps in data and research around this topic. The best source of data has previously been the Contingent Worker Survey from the Bureau of Labor Statistics, but the agency has not had funding to conduct the survey since 2005.

These nonstandard work arrangements are of interest to policymakers for many reasons, not least because contingent workers are two-thirds less likely than traditional workers to have workplace retirement plans, and less than half as likely to have health insurance through their employer (GAO 2015). Recently, the rising visibility of the gig economy has also increased policymakers' interest in non-standard forms of work in general, and in the effect of Uber on labor markets in particular. Quality data about workers in non-standard arrangements have been limited in recent years, however, as have detailed data about sharing economy participants.

Depending on how it is defined, the contingent workforce alternately estimated to be as little as less than five percent of the employed labor workforce or as much as a third.[vii] Using GSS data from 2010, the GAO identified a “core” group of contingent workers, defined as workers who lack job security and whose work schedules are variable, unpredictable, or both (such as agency temps, direct-hire temps, on-call workers, and day laborers). The agency estimated that this core group of contingent workers constitutes about 7.9 percent of the 2010 labor force, and similar proportions in 2005 and 2006. In late 2015, Katz and Krueger attempted to replicate the BLS surveys from 2005 and before using the RAND American Life Panel. Their findings suggest that the share of workers in alternative work arrangements has risen from 10.1% in early 2005 to 15.8% in late 2015, with online gig platforms (such as Uber) accounting for only a small part of this growth—about 0.5 percent of all workers in 2015 (Katz and Krueger 2016). However, they note that more research is needed to understand the causes of this increase.

Measuring the size of the sharing economy workforce in particular has been a challenge for researchers, due to the aforementioned hurdles in data collection combined with the newness of the industry. Measures of non-standard work in government surveys often does not match administrative or tax data (Abraham et al 2013), and standard survey questions do not appear to capture the nuances of work arrangements that the gig economy facilitates, such as the prevalence of multiple “gigs” in addition to a full-time traditional job. Even administrative data can be of limited use due to the workers’ official “independent” (i.e. non-payroll) status.

In 2015, Harris and Krueger estimated that “about 600,000 workers, or 0.4 percent of total U.S. employment, work with an online intermediary in the gig economy” as of late 2015, based on projecting recent Uber workforce growth rates and indexing these rates with the relative prevalence of web searches for other gig economy platforms (Harris and Krueger 2015). Researchers at the JPMorgan Chase & Co. Institute reached similar conclusions: After analyzing transactions from a random sample of one million primary account holders from October 2012 to September 2015, they found that in any given month, 0.4 percent of bank account holders received earnings from labor platforms such as Uber and Taskrabbit (Farrell and Greig 2016).

Similarly, there has yet to be a deep analysis of the effect these new types of companies have in the cities they operate in. One paper used a differences-in-differences approach to look at the effect of Airbnb on hotel revenue in Texas, for instance (Zervas 2015), while a recent Harvard Business Review article uses Census data about non-employee firms to compare the effect of sharing economy “gigs” in San Francisco in 2009 and 2013, an approach with its own set of limitations (Hathaway 2015).

How this paper contributes to the literature

Nationally, the total number of drivers for Uber and Lyft collectively equal the size of the entire taxi industry (Cramer and Krueger 2015), and some data show that these new drivers are directly competing with taxi drivers for business. But most analyses of the impact of TNCs on the taxi industry have looked at indicators only in New York City—which, while a major metropolitan center and a vital piece of the taxi industry, is unique in many characteristics. These include its size and density (NYC 2015), use of public transportation (Anderson 2016), and the long history of the taxi industry there (Hodges 2009), making it difficult to expand those trends to the entire country (Cramer and Krueger 2015). As far as I am aware, there has not yet been an analysis of the impact of TNCs on national taxi driver employment that takes into account broader trends such as the changing demographics of the industry or the specific pattern of TNC expansion.

Uber has also had an impact outside the taxi industry by pioneering new logistics systems that allow coordination of large flexible workforces, and the collective impact of these online platforms is still largely unexplored. While there have been many analyses that attempt to discern the sharing economy’s impact on the U.S. workforce using descriptive statistics, most have not accounted for larger demographic and economic trends. Few have looked specifically at metropolitan statistical areas (MSAs) where TNCs are active (Hall and Krueger 2015), and none, to my knowledge, have controlled for TNCs’ presence in a national context. This is important because the recent nature of Uber’s rise and relatively small size of its workforce, and the fact that it has spread to different cities at different times, means that broad analyses may not detect present changes due specifically to these companies.

This paper contributes to the literature by examining the effect of TNCs on the taxi labor market.  It is a first attempt to control for the specific patterns of TNCs’ expansion in a way that has not yet been done.

III. CONCEPTUAL FRAMEWORK

TNC impact on taxi driver employment

Uber officially launched in San Francisco in 2010, but it wasn’t until 2012 that UberX, Lyft, and Sidecar were launched and TNCs began to directly compete with taxis on a large scale. The rise of TNCs happened as the national economy was slowly recovering from the Great Recession, meaning many workers were still looking for opportunities to work part-time to augment their regular income or tide them over between full-time jobs. Another factor at the time was the “bursting” of the taxi medallion bubble in New York City and the general dip in taxi employment after the recession, which began to recover by 2014-2015 even as revenues in major cities often declined.

Based on these factors, I hypothesize that the presence of TNCs in an MSA will be negatively correlated with the likelihood of taxi driver employment compared with MSAs where TNCs are not active, on average. I also hypothesize that the impact of TNCs will be greater the longer they have been active in an MSA, with an increasingly negative impact as time goes on. My model will account for individual worker characteristics to control for general workforce changes, as well as characteristics specific to MSAs such as unemployment and overall population. My model will also account for year effects, and one model will account for MSA effects. While I do not have a true control group, I will control for whether an MSA was in the “treatment” group that ever had a TNC active.

IV. DATA AND METHODS

Data source for dependent variables and controls

The main source of data for this study is the U.S. Census Bureau’s Current Population Survey (CPS) for the years 2005-2015. The CPS is the U.S. Government's monthly survey of unemployment and labor force participation, and is sponsored jointly by the Census Bureau and the Bureau of Labor Statistics (BLS). The CPS is continuously administered by the Census Bureau using a probability selected sample of about 60,000 occupied households, including households from all 50 states and the District of Columbia; the merged outgoing rotational group (MORG) files collected by The Center for Economic and Policy Research include all adult respondents in the outgoing rotation group, and contains detailed information on respondents’ demographic characteristics, education, and labor-market status.[viii] I will be analyzing it as pooled cross-sectional data set.[ix] The CPS is the best available data source to study labor market impacts of TNCs due to its recency (data is available through the end of 2015.  This also makes it useful for measuring taxi drivers’ employment, as many are also independent contractors and present similar measurement challenges.

Data about the annual population estimates for MSAs are from the Census Bureau’s Annual Estimates of the Resident Population via American FactFinder[x], and monthly unemployment rates are from the Local Area Unemployment Statistics from the Bureau of Labor Statistics.[xi] These are included because they are both MSA-specific and time-varying, and may affect the outcome variables of interest through various channels.

Data source for independent variables of interest

Information about the timing of TNC operations in MSAs was collected through searches of Uber and Lyft’s blogs and online news archives. The dates of Lyft’s expansion into major markets were verified by a list provided by a Lyft representative. MSAs were coded as having a TNC present if Uber or Lyft was active in a major city or regional market within that MSA during that month. I also only considered the activity of TNCs after June 2012. This is when Uber’s lower-cost, non-professional service UberX launched, and Lyft had just started in San Francisco in beta (Cutler 2012); previously Uber’s core service had been its on-demand black car service, now included in UberBLACK (Uber Ohio 2016). The steady rate of growth among black car drivers compared with the rapidly increasing growth of UberX drivers (Hall and Krueger 2015), combined with the price differences and driver requirements, suggest that the launch of UberX and Lyft are more relevant to this paper’s analyses than the launch of Uber’s original black car service.

Uber was the first TNC to launch in almost all MSAs, although Lyft was the first TNC in a handful. While there have been many TNC start-ups, Uber is the dominant presence, with Lyft its main competitor (Harris and Krueger 2015), and the analysis assumes that there were no MSAs that had a notable TNC presence other than Uber or Lyft without one of the two also being present. I also counted Uber as the first TNC to launch overall, as pre-internet ride-sharing or on-demand carpooling services (such as Lyft’s progenitor Zimride) have traditionally served different needs and have not competed with taxi services as directly. MSAs where Uber or Lyft were only briefly active due to market conditions or legal challenges (e.g. areas in New York state outside of New York City, such as Buffalo and Rochester) are coded as never having TNCs active, as their presence was likely too brief to have a major impact on the taxi industry. However, this may underestimate the effects of TNCs in those cities on non-taxi employment measures, as other online gig platforms that are not directly related to transportation might still have become active.

Regression method

Using the above data, I will estimate the following regression:

where i is an MSA index, t is a year index, αI represents a vector of MSA dummy variables, γt represents dummy variables for each year and eit is the error term. TNC_presence is a dummy variable indicating whether a TNC was active in a respondent’s MSA at the time of the CPS survey (from June 2012 onward), and TNC_presence_length refers to the length of time the TNC had been active in years (non-integers). The coefficient on TNC_presence, ß1, is the main coefficient of interest, and represents the difference in the likelihood that an individual will identify as the dependent category of interest (taxi driver) between MSAs with a TNC present and those without TNCs, holding constant all the covariates discussed earlier. Table 1 provides full definitions for all the variables included in the model.

Descriptive statistics

Because each sample was restricted to meet specific constraints[xii], the samples tend to include a higher proportion of large MSAs than the full sample would contain, which affects the characteristics of workers in each of those samples. The basic contours of those samples are shown in descriptive statistics in Table 2.

The sample for the taxi driver employment analyses is the most restricted, and has the highest proportion of high-income and –education individuals (although all three are skewed relative to the general U.S. population). The taxi sample also has the highest proportion of Hispanic workers and non-U.S. born respondents, as well as higher hourly wages on average and a higher proportion of union coverage.

V. RESULTS AND ANALYSIS

Taxi driver employment

Means

Tables 3 and 4 show the weighted proportion of taxi drivers among employed workers in the restricted sample for this analysis. Table 3 shows the proportion of taxi drivers of workers based on whether any TNCs were present in the MSA at the time of the survey. Table 4 shows the mean and standard deviation of taxi drivers in the workforce based on how many years TNCs had been active in the MSA at the time of the survey. While almost all of the MSAs had a TNC active by the end of 2015, most of the Uber and Lyft’s expansion occurred in 2014.

Regression results

The use of a true difference-in-differences regression model in this case is difficult because TNCs expanded into different areas at different times, meaning there is no single date of “treatment.” They also expanded so rapidly that there are very few MSAs within the restricted sample that did not have a TNC present by the end of 2015.

Instead, I explored the potential effect of TNCs on taxi employment through models that account for individual and MSA characteristics. Table 5 reports the results from these models, in which the dependent variable is the probability that an employed worker is a taxi driver (taxi, which equals 1 if yes).

Model 1 simply regresses taxi onto three variables related to TNCs’ presence: whether a TNC was present in the worker’s MSA the month of the CPS survey, the years that TNCs have been present in that MSA, and the years of TNC presence squared. Model 2 adds control variables related to individual worker demographic characteristics, and Model 3 adds two time-varying MSA-level controls (annual population and monthly unemployment rate). Model 4 adds indicators for year effects, and Model 5 adds indicators for each MSA.

None of TNC-related independent variables of interest were significant at standard levels in any of the models when using mid-2012 as the benchmarked start date for TNC activity. Among the control variables, almost all of the individual-level demographic controls were statistically significant at standard levels in all of the models. Focusing here on the results from Model 5, we find the sign of these coefficients as expected: Age is positively associated with being a taxi driver, while being female is very strongly negatively associated. Black workers are more likely than white workers to be taxi drivers, and Hispanic worker are less likely. Workers with a high school diploma are more likely to drive taxis than those who have not graduated high school or who have attended college. Looking at family income, those reporting less than $30,000 per year are significantly more likely to drive taxis compared with those earning $30,000-$50,000, while those with higher family earnings are less likely. Married workers and those with children are more likely to drive taxis, controlling for other factors. Being born outside the United States also has a very strong positive association with being a taxi driver, an increase of 0.82 percentage points.

Finally, two MSA-level time-varying factors, yearly population and monthly unemployment, were present in Models 3-5. Yearly population was highly significant in Models 3 and 4, but it not significant in Model 5 when MSA indictors were added. The monthly unemployment rate was not significant in Models 3 or 5, but was in Model 4 with the addition of year indicators (but not MSA indicators).

VI. DISCUSSION AND CONCLUSION

Discussion

Taxi driver employment

This analysis failed to find evidence of a statistically significant relationship between the presence of TNCs and taxi driver employment, even though other evidence suggests that TNCs are competing with taxis for business and resulting in declining revenues. There are a few potential explanations for this lack of an apparent effect.

First, it is possible that TNCs have not yet had an impact on taxi driver employment even if taxi drivers are earning less in cities where TNCs are present. It is possible that taxi drivers may be driving longer hours or taking home less in weekly pay as a result of TNCs, but that few have decided to leave the occupation entirely. This seems likely, as most respondents in the sample with a TNC present lived in an MSA where the TNC had been present only in the previous year. Second, there is the possibility that there are endogenous effects to the taxi industry in certain MSAs that have not been accounted for in these models, which have only two time-varying MSA controls. Third, there may be an issue of measurement if a large proportion of current and former licensed taxi or limo drivers who primarily drive for Uber platforms still identify as being in the “taxi driver and chauffeur” occupation on CPS surveys even when they are primarily or entirely working for TNCs. Finally, there is the possibility that TNCs have expanded the market for on-demand car services nationally, particularly in cities other than major metropolitan areas (such as New York, San Francisco, Boston, and Washington, DC), in a way that increased demand for taxi services as well as TNC services from 2012-2015.

Limitations and avenues for future research

The most pressing limitation of the analysis is that all the TNCs studied were initially launched in San Francisco and generally followed an expansion pattern that began with major metropolitan areas such as New York City, Boston, Chicago, and Los Angeles. Therefore, the MSAs which have had TNCs in 2012 or 2011 are very different than the “control” groups that did not have TNCs present until 2014 or later. Because the CPS is only representative for the 12 largest MSAs, and ACS data that would give representative variables for all MSAs in the samples was only available through 2014, the model did not control for many time-varying MSA characteristics that could have affected the taxi industry and larger labor markets in those areas. This omission could obscure the true effect of TNCs on those dependent variables.

Another limitation not yet mentioned is that the analysis did not use clustered standard errors due to a missing variables for one year of data, which means that standard errors may be larger than reported.[xiii] An analysis of a smaller time span—for instance, 2007-2015—might allow for smaller standard errors. It will also be useful to re-run the analysis once data for 2016 is available, or when ACS data for 2015 is published.

The results of the taxi analysis suggest that there are also exogenous effects related to the taxi industry that were not accounted for in the model, as previously discussed. The model also did not take into account specific factors at the MSA level that could have affected the number of taxi drivers, such as New York City’s introduction of green cabs or “Boro Taxis” in 2013 (Giuffo 2013), or TNC-related legislation that has been passed in many cities and states.

One measurement concern is that taxi drivers, limo drivers, and other professional drivers who switch entirely to driving to Uber or Lyft might lead to an underestimation of the effects of TNCs on “taxi” employment, as they might be likely to still identify themselves as “taxi drivers or chauffeurs” drivers on CPS surveys. For instance, a study commissioned by Uber found that in December 2014, about half (49%) of Uber drivers had previously worked as a driver (including for a delivery service), but by November 2015, only 33% had previously earned income driving[xiv] (Uber 2015).

Conclusion

This study did not find evidence that transportation network companies such as Uber and Lyft have yet had a significant impact on taxi employment in the metropolitan areas in which they operate. Additional study is needed as more data becomes available in order to understand how these platforms are affecting the mix of transportation options in their cities. TNCs are already having an impact—the city of Altamonte Springs, Florida recently decided to subsidize residents’ Uber fares in lieu of an on-demand bus system (Wood 2016)—but very few cities are even considering TNCs in their long-term transportation plans (DuPuis et al. 2015). If TNCs, which require smartphones and credit cards to be used, replace taxis, which accept cash and street hails, this could have a major impact on residents’ access to transit options.

IMG_0116.JPG

+ Appendix A: Characteristics of employed taxi drivers, 1980-2015

alt text

+ Appendix B: Variable Definitions

alt text

alt text

+ Endnotes

  1. The original analysis also examined the relationship between the presence of TNC's and self employment, as well as multiple job holding. These analyses were removed from the published version due to space considerations.
  2. Many definitions of the "gig" or "sharing economy" include asset- or capital-based platforms like Airbnb (Farrell and Greig 2016), but this paper will focus on labor-based platforms in order to examine workforce trends.
  3. Uber is reportedly valued at $62.5 billion, with its nearest competitor Lyft approaching $4 billion (Isaac and Picker, 2015).
  4. Another reason to assume that the drivers for UberX, Lyft, and Sidecar (while it was active) are similar is that many drivers use multiple services simultaneously to search for fares. For more information, see Van Maldegiam 2015.
  5. The paper is based on a web survey of 601 active driver-partners conducted in December 2014 by Benenson Strategy Group (BSG) as well as aggregate administrative data.
  6. Based on administrative data, Uber had 160,00 "active drivers," defined as a driver who completed at least four trips in the month.
  7. A small amount of this is likely due to the introduction of "green cabs" serving outer boroughs.
  8. For instance, the Bureau of Labor Statistics (BLS) defines contingent workers as those in temporary employment (regardless of work arrangement), while other measures focus exclusively on the type of work arrangement. This second approach, which can include workers such as agency temps and day laborers, even if they are part-time workers, independent contractors, or self-employed, brings the estimation of the size of the contingent workforce up to 40.4 percent in 2010. Different definitions or focuses result in different interpretations of workforce trends. The narrowest scopes, such as those looking solely at self-employed workers or those who fall under the strictest definitions of the contingent workforce, show little change in the relative percentage of workers under those classifications prior to 2010. The broader definitions of the contingent or "freelance" workforce, however, have shown marked gains since at least the mid-2000s.
  9. The data I am using in my main analysis of years 2005-2015, as well as analyses of taxi driver employment from 1980-2015, is from merged data extracts provided by Center for Economic and Policy Research (CEPR), available at ceprdata.org. Data are weighted by the CPS earnings weight, listed in the CEPR data extracts as orgwgt.
  10. Note: While attempts were made to address the creation or re-numbering of MSAs that occurred after the 2010 Census, this paper does not account for changes to individual MSAs' boundaries in the 2014-2015 data ("Technical Note" 2013).
  11. Available at http://factfinder.census.gov/.
  12. Available at http://www.bls.gov/lau/lausad.htm.
  13. Observations were only included if the unweighted count of the dependent variable of interest in that MSA that year was at least 3.
  14. For more information, see http://ceprdata.org/cps-uniform-data-extracts/cps-outgoing-rotation-group/cps-org-faq/#error.
  15. Based on online surveys conducted by BSG of drivers in Uber's largest markets.

+ References

Abraham et al. (2013). Exploring Differences in Employment between Household and
Establishment Data. Journal of Labor Economics, 31 (2): S129-S172
Alba, D. (22 June 2015). Instacart shoppers can now choose to be real employees. Wired.
http://www.wired.com/2015/06/instacart-shoppers-can-now-choose-real-
employees/
Anderson, M. (2016). Who relies on public transit in the U.S. Pew Research Center. http://www.pewresearch.org/fact-tank/2016/04/07/who-relies-on-public-transit-in- the-u-s/
Barro, J. (7 January 2015). New York City Taxi Medallion Prices Keep Falling, Now Down About 25 Percent. The New York Times. http://www.nytimes.com/2015
/01/08/upshot/new-york-city-taxi-medallion-prices- keep-falling-now-down- about-25-percent.html
Bernhardt, A. (2014). Labor Standards and the Reorganization of Work: Gaps in Data and Research. Institute for Research on Labor and Employment. http://www.irle.berkeley.edu/workingpapers/100-14.pdf.
Bidwell, M., and Briscoe, F. (2009). Who Contracts? Determinants of the Decision to
Work as an Independent Contractor among Information Technology Workers. The Academy of Management Journal,__52 (6): 1148–68.
Biju, Mathew. (2005). Taxi! Cabs and Capitalism in New York City. New York: New Press.
Center for Economic and Policy Research. (2016). CPS ORG Uniform Extracts, Version 2.1.
City of New York. (2016). NYC Population: Population Facts. http://www1.nyc.gov/site/planning/data-maps/nyc-population/population- facts.page
Cutler, K. (22 May 2012). Zimride's Lyft Is Going To Give Uber Some Lower-Priced
Competition. Techcrunch. http://techcrunch.com/2012/05/22/zimrides-lyft-is- going-to-give-uber-some-lower-priced-competition/
Davidson, A. (25 February 2016) Managed By Q's 'Good Jobs' Gamble. The New York Times. http://www.nytimes.com/2016/02/28/magazine/managed-by-qs- good-jobs-gamble.html
Davis-Blake, A. and Uzzi, B. (1993) Determinants of Employment Externalization: A Study of Temporary Workers and Independent Contractors. Administrative Science Quarterly__38 (2): 195–223.
DuPuis, N., Martin, C., and Rainwater, B. (2015). City of the Future: Technology and Mobility. National League of Cities. http://www.nlc.org/Documents/
Find%20City%20Solutions/Research%20Innovation/City%20of%20the%20Futur e/City%20of%20the%20Future%20FINAL%20WEB.pdf
Farrell, D. and Greig, F. (2016). Paychecks, Paydays, and the Online Platform Economy: Big Data on Income Volatility. JPMorgan Chase & Co. Institute. https://www.jpmorganchase.com/corporate/institute/document/jpmc-institute- volatility-2-report.pdf
Feuer, A. (19 February 2016). Uber Drivers Up Against the App. The New York Times. http://www.nytimes.com/2016/02/21/nyregion/uber-drivers-up-against-the- app.html
Federal Housing Finance Agency. Technical Note: Transitioning to the New OMB 2013 Metropolitan Area Definitions. http://www.fhfa.gov/datatools/downloads/
documents/hpi_focus_pieces/2013q2_hpifocus_n508.pdf.
Fischer-Baum, R. and Bialik, C. (13 October 2015). Uber Is Taking Millions Of Manhattan Rides Away From Taxis. FiveThirtyEight. http://fivethirtyeight.com/
features/uber-is-taking-millions-of-manhattan-rides- away-from-taxis/
Gannes, L. (26 June 2012). Sunil Paul's SideCar Ride-Sharing App Will Flag a Stranger's Car for You. All Things D. http://allthingsd.com/20120626/sunil-pauls- sidecar-app-will-flag-a-strangers-car- for-you/
Gilbert, G. and Samuels, R.E. (1982) The Taxicab: An Urban Transportation Survivor. Chapel Hill: University of North Carolina Press.
Giuffo, J. (30 September 2013). NYC's New Green Taxis: What You Should Know. Forbes. http://www.forbes.com/sites/johngiuffo/2013/09/30/nycs-new-green- taxis-what-you-should-know/
Government Accountability Office. (2015). Contingent Workforce: Size, Characteristics, Earnings, and Benefits. http://www.gao.gov/assets/670/669766.pdf.
Graham, J. (8 March 2011). Uber app hails a Town Car for you. USA Today. http://usatoday30.usatoday.com/tech/products/2011-03-08-uber-car-app_N.htm
Griswold, A. (10 Decmber 2015). Three US states have already blessed Uber's independent contractor employment model. Quartz. http://qz.com/571249/three- us-states-have-already-blessed-ubers-independent-contractor-employment-model/
Grynbaum, M. M. (22 May 2012). New York Taxi Drivers Unsure They Will See Benefits of a Fare Increase. New York Times.
Hall, J.V., and Krueger, A. (2015) An Analysis of the Labor Market for Uber's Driver- Partners in the United States. Industrial Relations Section, Princeton University. http://dataspace.princeton.edu/jspui/handle/88435/dsp010z708z67d.
Harris, S. and Krueger, A. (2015). A Proposal for Modernizing Labor Laws for Twenty- First Century Work: The 'Independent Worker.'The Hamilton Project. http://hamiltonproject.org/papers/modernizing_labor_laws_for _twenty_first_century_work_independent_worker
Hathaway, I. (13 August 2015). The Gig Economy Is Real If You Know Where to Look. Harvard Business Review. https://hbr.org/2015/08/the-gig-economy-is-real-if- you-know-where-to-look.
Hawkins, A.J. (21 December 2015). Even with new funding round, Lyft's valuation is a shadow of Uber's." The Verge. http://www.theverge.com/2015/12/21/10635868/
lyft-billions-valuation-uber-rideshare-war
Hipple, S. F. (2010). Self-employment in the United States. U.S. Bureau of Labor Statistics Monthly Review. http://www.bls.gov/opub/mlr/2010/09/art2full.pdf
Hodges, G., and Gao, R. (2009). Taxi!: A Social History of the New York City Cabdiver. Baltimore: Johns Hopkins University Press.
Hockenson, L. (29 December 2015). RIP Sidecar: Ridesharing service announces shutdown. The Next Web. http://thenextweb.com/apps/2015/12/29/rip-sidecar- ridesharing-service-announces-shutdown/
Isaac, M., and Picker, L. (3 December 2015). Uber Valuation Put at $62.5 Billion After a New Investment Round. The New York Times. http://www.nytimes.com/ 2015/12/04/business/dealbook/uber-nears-investment-at-a-62-5-billion- valuation.html
Kalleberg, A. L. (2000). Nonstandard Employment Relations: Part-Time, Temporary and Contract Work. Annual Review of Sociology__26 (2000): 341–65.
Lalé, E. (2015) Multiple jobholding over the past two decades." U.S. Bureau of Labor Statistics Monthly Labor Review. http://www.bls.gov/opub/mlr/2015/article/
multiple-jobholding-over-the-past-two-decades.htm
Lawlor, R. (6 September 2012). On-Demand Ride-Sharing Service Lyft Adds $1 Million In Excess Liability Insurance For Drivers. TechCrunch. http://techcrunch.com/
2012/09/06/lyft-1m-insurance/
Madhani, A. (7 May 2015). Once a sure bet, taxi medallions becoming unsellable. USA Today. http://www.usatoday.com/story/news/2015/05/17/taxi-medallion-values- decline-uber-rideshare/27314735/
Malik, O. (13 February 2011). Uber All Set To Pick Up New VC Money. Giga Om. https://gigaom.com/2011/02/13/uber-funding/
McCarthy, C. (21 January 2011). Can an SF start-up help hail a cab in NY? CNET. http://www.cnet.com/news/can-an-sf-start-up-help-hail-a-cab-in-ny/
Newcomer, E. N. (3 December 2015). Uber Raises Funding at $62.5 Billion Valuation." Bloomberg. http://www.bloomberg.com/news/articles/2015-12-03/uber-raises- funding-at-62-5-valuation
Rosenblat, A., and Stark, L. (2015). Uber's Drivers: Information Asymmetries and Control in Dynamic Work. Social Science Research Network.
Rosenblatt, J. (21 September 2015). Uber Loses Bid to Force Arbitration on California Driver. Bloomberg. http://www.bloomberg.com/news/articles/ 2015-09-21/uber- loses-bid-to-force-arbitration-on-california-driver.
Sachs, B. (8 December 2015). Do We Need an 'Independent Worker' Category? On Labor.http://onlabor.org/2015/12/08/do-we-need-an-independent-worker- category/
Scheiber, N. (10 December 2015). A Middle Ground Between Contract Worker and Employee. The New York Times. http://www.nytimes.com/2015/ 12/11/business/a-middle-ground-between-contract-worker-and-employee.html
Soper, T. (11 June 2015). The Uber effect: Seattle taxi industry revenue dipped 28% in past 2 years. GeekWire. http://www.geekwire.com/2015/the-uber-effect- seattletaxi-industry-revenue-dipped-28-in-past-two-years/
Toossi, M. (2002). A century of change: The U.S. labor force, 1950–2050. U.S. Bureau of Labor Statistics Monthly Labor Review. http://www.bls.gov/opub/
mlr/2002/05/art2full.pdf
U.S. Bureau of Labor Statistics. (2013). Labor force projections to 2022: the labor force participation rate continues to fall. U.S. Bureau of Labor Statistics Monthly Labor Review. http://www.bls.gov/opub/mlr/2013/article/labor-force-projections-to- 2022-the-labor-force-participation-rate-continues-to-fall.htm
U.S. Bureau of Labor Statistics. (2016). Employed full time: Wage and salary workers: Taxi drivers and chauffeurs occupations: 16 years and over. FRED, Federal Reserve Bank of St. Louis. Last accessed April 10, 2016. https://research.stlouisfed.org/fred2/series/LEU0254521800A
U.S. Bureau of Labor Statistics. (2005). Contingent and alternative employment arrangements, February 2005. http://www.bls.gov/news.release/pdf/conemp.pdf
Uber. (7 December 2015). New Survey: Drivers Choose Uber for its Flexibility and Convenience. https://newsroom.uber.com/driver-partner-survey/
Uber Ohio. (10 April 2016). UberBLACKvs. UberX. https://drive.uber.com/oh/uberblack -vs-uberx/
Van Maldegiam, S. (4 February 2015). How To Drive For Uber And Lyft At The Same Time. The Rideshare Guy. http://therideshareguy.com/how-to-drive-for-uber-and- lyft-at-the-same-time/
Wallsten, S. (9 July 2015). Has Uber Forced Taxi Drivers to Step Up Their Game? The Atlantic. http://www.theatlantic.com/business/archive/2015/07/uber-taxi-drivers- complaints-chicago-newyork/397931/
Weil, D. (2015). Administrator's Interpretation No. 2015-1. Subject: The Application of the Fair Labor Standards Act's 'Suffer or Permit' Standard in the Identification of Employees Who Are Misclassified as Independent Contractors. U.S. Department of Labor Wage and Hour Division. http://www.dol.gov/whd/workers
/Misclassification/AI-2015_1.htm.
Wile, R. (27 July 2015). There Are Probably Way More People in the 'Gig Economy' Than We Realize. Fusion. http://fusion.net/story/173244/there-are-probably-way- more-people-in-the-gig-economy-than-we-realize/
Wingfield, N., and Isaac, M. (14 December 2015). Seattle Will Allow Uber and Lyft Drivers to Form Unions. The New York Times. http://www.nytimes.com/2015/12/
15/technology/seattle-clears-the-way-for-uber-drivers-to-form-a-union.html
Wortham, J. (3 May 2011). With a Start-Up Company, a Ride Is Just a Tap of an App Away. The New York Times. http://www.nytimes.com/2011/05/04/
technology/04ride.html
Zatz, N. (1 February 2016). Is Uber Wagging the Dog With Its Moonlighting Drivers? On Labor. https://onlabor.org/2016/02/01/is-uber-wagging-the-dog-with-its- moonlighting-drivers/
Zervas, G., Proserpio, D, and Byers, J. (2015). The Rise of the Sharing Economy: Estimating the Impact of Airbnb on the Hotel Industry. Boston U. School of Management.http://papers.ssrn.com/abstract=2366898
Zumbrun, J., and Sussman A. L. (26 July 2015). Proof of a 'Gig Economy' Revolution Is Hard to Find. Wall Street Journal.http://www.wsj.com/articles/proof-of-a-gig- economy-revolution-is-hard-to-find-1437932539

Kathryn Zickuhr is a researcher and policy lead at the D.C. Policy Center, a new think tank focused on local policy issues in the District of Columbia. Previously, she was a Research Associate at the Pew Research Center’s Science & Technology Project, where she published reports on topics ranging from location-based services to the digital divide. She has been interviewed by the Associated Press, the New York Times, NPR, the Washington Post, and other major news outlets regarding Pew’s research.

In 2016, Kathryn completed her M.P.P. at the McCourt School of Public Policy at Georgetown University, focusing on domestic social and economic policy. While at McCourt, she spent time at the U.S. Senate Committee on Health, Education, Labor and Pensions, the National League of Cities, and the Consumer Financial Protection Bureau as a graduate intern. She has also worked as a research consultant for the Data & Society Research Institute, where she contributed to reports on privacy and online harassment.

IMG_0124.JPG