
The Relationship Between Latinx Enrollment and School District Rates of Free or Reduced-Price Lunch Eligibility
Nima Rahimi
Abstract: I explore the relationship between the reported share of students eligible for free or reduced-price lunch at the school district level and the share of Latinx students while controlling for the share of school-aged children in poverty. School-level free or reduced-price lunch eligibility (FRPLE) counts are often used as a proxy for poverty or socioeconomic disadvantage and used by many states and school districts to allocate additional funding to individual schools that may serve more socioeconomically disadvantaged students. However, the implementation of the Community Eligibility Provision (CEP) in 2010 has further complicated the use of FRPLE counts to allocate funding to individual schools. CEP allows high-poverty schools or school districts the ability to enroll their entire student body in a subsidized meal program if at least 40 percent of their students are enrolled in another public benefit program like the Supplemental Nutrition Assistance Program (SNAP). Latinx families and students are often under-enrolled in public benefit programs such as SNAP. Thus, the expansion of CEP may systematically exclude eligible Latinx students from FRPLE counts because they may not be enrolled in SNAP. The coefficient I estimate for each 0.01 (1.0 percentage point) increase in the share of school-aged children in poverty and the associated percentage point increase in FRPLE in school districts with a large share of Latinx students, is roughly 62.3 percent less than the estimated coefficient for school districts with a large share of white students.
I. Introduction
Free or reduced-price lunch eligibility (FRPLE)[1] counts are often used as a proxy for poverty and socioeconomic disadvantage[2] (Snyder and Musu-Gillette, 2015; Skinner and Aussenberg, 2016). Allocation of federal Title I funds under the Elementary and Secondary Education Act (ESEA) in addition to other federal and state-level funds can depend on FRPLE counts at the school, school district, or state level (Skinner and Aussenberg, 2016; Dynarski and Kainz, 2015). Thirty-five states, including the District of Columbia, use FRPLE in some manner to allocate additional school-level funding (FRAC, 2019c).
Targeted funding to individual schools serving large numbers of disadvantaged students often relies on FRPLE (FRAC, 2019a; FRAC, 2019b; Skinner and Aussenberg, 2016). A fundamental problem with FRPLE as a proxy for poverty and disadvantage is that individual schools report FRPLE counts. The accuracy of FRPLE counts is contingent on the ability of individual schools to collect subsidized meal applications (SMAs) from all eligible students and accurately report the exact number of students eligible for free or reduced-price lunch. FRPLE, through the completion of SMAs, is based on income (FRAC, 2021a). Household income reported by families is usually self-reported (Domina et al., 2018; USDA, 2017). The accuracy of FRPLE counts is contingent on the ability of individual schools to collect SMAs, individual schools accurately reporting the exact number of eligible students, and households accurately reporting their income. Thus, the reported FRPLE counts are unlikely to equal the unobserved true FRPLE counts. The true FRPLE counts are only possible under perfect identification of students by schools, perfect reporting of eligible students by schools, and perfect reporting of income by households.
Additionally, the passage of the Healthy Hunger-Free Kids Act (HHFKA) in 2010 may have further harmed the accuracy of FRPLE counts (Chingos, 2016). The HHFKA introduced the Community Eligibility Provision (CEP). CEP allows eligible schools and school districts to offer all enrolled students free meals (Skinner and Aussenberg, 2016). CEP made it easier and more common for districts to offer free meals to all enrolled students (FRAC, 2020b; FRAC, 2019b). Students automatically qualify for subsidized meals if they live in a household receiving at least one of the specified means-tested public benefits programs. States most commonly use the Supplemental Nutrition Assistance Program (SNAP) (Gordon and Ruffini, 2019; Skinner and Aussenberg, 2016). Schools or districts participating in CEP may have stopped or reduced the collection of SMAs. Thus, CEP could change FRPLE counts and possibly alter school-level funding allocations and Title I eligibility (Skinner and Aussenberg, 2016).
Under CEP, automatic enrollment, or direct certification, requires that children be in a household enrolled in the specified public benefit program used by the state or school district (USDA, 2017). If schools, school districts, or states exclusively enrolled students for free or reduced-price lunch through direct certification, income-eligible students ineligible for the public benefit program used by the state would not appear in the FRPLE counts. Thus, FRPLE counts may not represent all eligible students.
Non-citizen households without a green card are ineligible for most public benefit programs, including SNAP (Hanson et al., 2014; USDA, 2013b). However, children from non-citizen households without a green card would be eligible for free or reduced-price lunch if they meet the household income requirement (USDA, 2017). While the data do not permit the identification of non-citizen households, Latinx households are often under-enrolled in public benefit programs they likely qualify for (Haley et al., 2020; Pino, 2019). I use the share of enrolled Latinx[3] students at the school district level as a proxy for public benefit program eligibility.
I contribute to the body of literature on FRPLE by evaluating the relationship between the share of students eligible for free or reduced-price lunch at the district level and the share of enrolled Latinx students while locally controlling for the share of school-aged children below the federal poverty line. Links between school area poverty as a measure of student disadvantage have been identified in previous studies and offer an alternative measurement of disadvantage (Greenberg et al., 2019; Geverdt, 2018; Nicholson et al., 2015; National Forum on Education Statistics, 2015). Thus, I use the interaction of Latinx students and the share of school-aged children in poverty as a proxy for disadvantaged Latinx students that would appear in the true FRPLE counts.
II. Flaws with Free or Reduced-Price Lunch Eligibility
The reported FRPLE counts do not reflect the true FRPLE counts. The true FRPLE counts do not capture all aspects of socioeconomic disadvantage. Thus, the use of reported FRPLE counts for allocating additional school-level funding for schools serving a large percentage of disadvantaged students is imperfect. FRPLE does not always reflect income. However, if FRPLE counts accurately reflected household income, they would still be a flawed proxy for disadvantage because household income alone fails to capture all aspects of student disadvantage (Domina et al., 2018; National Forum on Education Statistics, 2015; Harwell and LeBeau, 2010).
Students eligible for free lunch based on household income must be in a household with income at or below 130 percent of the federal poverty line (FRAC, 2020b; FRAC, 2019b). Children eligible for reduced-price lunch based on household income must be in a household with income between 130 to 185 percent of the federal poverty line (FRAC, 2020b; FRAC, 2019b). Foster, migrant, homeless, or runaway youth and households participating in SNAP, TANF, the Food Distribution Program on Indian Reservations (FDPIR), or Head Start are eligible to be directly certified for free or reduced-price lunch (FRAC, 2020b; FRAC, 2019b; USDA, 2013a).[4] Students from households at or below 185 percent of the federal poverty line not enrolled in SNAP or an alternate public benefit program allowing for direct certification will not appear in FRPLE counts if they have not completed an SMA provided to them by their school (USDA, 2017).
At a minimum, FRPLE counts depend on direct certification counts, public benefit enrollment, reported household income, and SMAs. For example, there is likely a relationship between school or school district effort in ensuring the identification and accurate completion of SMAs and FRPLE counts (Chingos, 2016). However, the data do not permit for the control of school district efforts dedicated to SMAs. School and school district level factors such as the stigma surrounding free or reduced-price lunch are also related to FRPLE counts. The stigma of being from a low-income family seems to be associated with free or reduced-price lunches, and a subsequent reduction in meal take up (Gordon and Ruffini, 2019; Greenberg et al., 2019; Leos-Urbel, 2013; Mirtcheva and Powell, 2009; Ralston et al., 2008; Glantz et al., 1994). Glantz et al. (1994) found that 20 percent of households with children eligible to receive free or reduced-price lunch did not enroll because of the associated stigma. Schools or school districts with high levels of meal-associated stigma or a culture of not encouraging students to complete SMAs could be reporting FRPLE counts lower than the true FRPLE counts.
FRPLE counts reflect household income or program enrollment at one point in time. Suppose a student is eligible for free or reduced-price lunch based on their household income, and the students’ parents or guardians lose their jobs shortly after the student returns their SMA. In that case, FRPLE is unlikely to reflect the new level of disadvantage (Michelmore and Dynarski, 2017). Furthermore, households where parents or guardians are frequently unemployed or engaged in seasonal work, could result in a volatile household income level which FRPLE would not capture. Michelmore and Dynarski (2017) examined the relationship between multiple years of FRPLE on standardized eighth-grade math test scores. They found that children who have been FRPLE since kindergarten score 0.94 standard deviations below children who have never been eligible for subsidized meals.
Direct certification is designed to ensure that students facing distinct forms of disadvantage[5] or enrolled in public benefit programs such as SNAP or Temporary Assistance for Needy Families (TANF) are guaranteed free or reduced-price lunch (USDA, 2017). Students eligible for free or reduced-price lunch but not through direct certification are eligible based on household income. As a measure of disadvantage, income alone fails to provide information on parental education, neighborhood resources, residential stability, wealth, and other characteristics associated with educational outcomes, experiences, and disadvantage (Cookson Jr, 2020; Domina et al., 2018; Chingos, 2016; Harwell and LeBeau, 2010; Hauser, 1994).
III. Under-Enrollment in Public Benefit Programs
School districts are not allowed to require that applicants for free or reduced-price lunch provide any information regarding their citizenship status (USDA, 2017).[6] Immigrants receiving free or reduced-price lunch do not become a public charge and therefore cannot be deported, denied entry, or denied permanent status due to their receipt of subsidized meals (USDA, 2019; USDA, 2017). Children from households that have immigrated, regardless of citizenship, to the United States are eligible for free or reduced-price lunch. Families that immigrated to the United States without documentation are virtually ineligible to receive SNAP benefits. Thus, non-citizen students from families without a green card that are income-eligible to receive free or reduced-price lunch would not be counted through direct certification.
Regardless of citizenship status, evidence may indicate that Latinx families eligible for public benefit programs like SNAP enroll at lower levels than non-Latinx families (Haley et al., 2020; Pino, 2020; Hanson et al., 2014; Perreira et al., 2012). In 2010, only 56 percent of Latinx families eligible for SNAP received the public benefit (Pino, 2020). A lack of enrollment among eligible Latinx families could be due to administrative barriers or strong anti-immigrant sentiment (Fortuny and Pedroza, 2014). Watson (2014) found that stricter immigration enforcement from 1995 to 1999 caused a 4.4 percentage point decline in immigrant Medicaid participation. In 2019, 20.4 percent of adults in immigrant families indicated that they or a family member avoided public benefits due to fears surrounding their green card status (Haley et al., 2020). Fears surrounding green card status were even more pronounced among low-income immigrant families, with 31.5 percent avoiding public benefits due to green card fears (Haley et al., 2020).
To my knowledge, there is no evaluation of whether Latinx or immigrant families are avoiding free or reduced-price lunch and choosing not complete SMAs due to fears over their green card status. The under-enrollment in SNAP among Latinx and immigrant families would likely result in direct certification counts excluding income-eligible Latinx students at greater levels than some of their peers. If some districts are exclusively enrolling children in free or reduced-price lunch through direct certification, income-eligible Latinx and immigrant students could be heavily underrepresented in FRPLE counts.
IV. The Community Eligibility Provision
In 2010, Congress implemented CEP through the Healthy, Hunger-Free Kids Act (HHFKA) and is currently the largest federal program to provide schoolwide free meals (Gordon and Ruffini, 2019). CEP's goal was to reduce paperwork and expand access to subsidized school meals (Greenberg et al., 2019). CEP is intended to allow schools and districts serving a large percentage of high-poverty students the ability to serve breakfast and lunch for free and without collecting SMAs (USDA, 2019). Schools that adopt CEP are reimbursed based on the share of students automatically enrolled through direct certification due to their participation in a means-tested public benefits program like SNAP (USDA, 2019). Schools within a district or an entire district with at least 40 percent of their students identified as qualifying for free or reduced-price lunch based on their enrollment in another public benefit program can participate in CEP (USDA, 2015). Schools that do not meet the 40 percent identified student percentage (ISP) threshold but are within participating districts that meet the ISP requirement are still eligible to participate (Gordon and Ruffini, 2019). CEP was rolled out gradually in select states starting in 2010 but has been available nationwide since 2014 (USDA, 2015).
CEP has been steadily increasing since 2014, and in 2017-18, 28,614 schools in 4,698 school districts participated in CEP (Greenberg et al., 2019; USDA, 2017). As of 2019, 30,667 schools participate, 5,133 districts have at least one school participating, and 69 percent of all eligible schools participate in CEP, with 14.9 million children attending a school that offers free lunch through CEP (FRAC, 2019b). CEP is the new normal, and more schools and districts are likely to adopt the provision. The expansion of CEP could change the students represented in FRPLE counts. If groups of students and families are systematically excluded from public benefit programs but are income-eligible to receive free or reduced-price lunch, they would not appear in CEP direct certification counts. If schools and districts that have adopted CEP significantly decrease their collection of SMAs, then FRPLE counts may significantly underrepresent income-eligible students from households not enrolled in public benefit programs like SNAP.
Although CEP expansion has been associated with increases in academic achievement, positive long-term health outcomes (Ruffini, 2018), and decreases in-school suspensions (Gordon and Ruffini, 2019), inaccurate FRPLE counts alter who is represented and what FRPLE represents as a proxy for poverty or disadvantage. Latinx students, immigrants, and English language learners are often captured at lower rates in CEP direct certification counts (Greenberg et al., 2019) due to an under-enrollment in public benefit programs (Pino, 2020; Hanson et al., 2014).
School incentives may also explain differences in CEP direct certification counts and FRPLE counts. CEP participating schools might be less incentivized to report accurate FRPLE counts or collect SMAs once they cross the 40 percent ISP threshold. Reporting indicates that some schools participating in CEP choose to report 100 percent FRPLE eligibility once they cross the 40 percent ISP direct certification threshold (Greenberg et al., 2009). The meaning of FRPLE counts would be forever changed if the widespread adoption of CEP came at the cost of accurately representing students and families systematically excluded from public benefit programs and schools reporting their FRPLE counts in earnest. Thus, reported FRPLE counts as a measure of poverty or disadvantage would not be accurate. Inaccurate FRPLE counts could affect Title I status, school-level funding, and the ability of researchers to conduct school-level studies on the effects of poverty or disadvantage.
V. Literature Review
FRPLE as a proxy for poverty or student disadvantage seems to be accepted as acceptable (Kodel and Parsons, 2021; Domina et al., 2018) while also statistically noisy and imperfect (Kodel and Parsons, 2021; Michelmore and Dynarski, 2017; Harwell and LeBeau, 2010). However, the use of FRPLE to allocate funding to individual schools is driven by necessity. There are very few available and standardized measures of poverty or disadvantage available at the individual school level (Greenberg, 2019; Greenberg et al., 2019; Domina et al., 2018). As more schools and districts begin to adopt CEP, some researchers (Greenberg et al., 2019; Greenberg, 2018; Chingos, 2016) worry that FRPLE counts will become an even less acceptable measure of poverty or disadvantage. CEP is not going anywhere. Researchers and policymakers must understand how accurately FRPLE counts are in capturing disadvantage and to what degree the adoption of CEP may have eroded the usefulness of FRPLE as a proxy for poverty or disadvantage.
Previous studies seem to support the use of FRPLE as an imperfect but relatively reasonable proxy for disadvantage. Domina et al. (2018) examined the relationship between FRPLE and different measurements of socioeconomic disadvantage. The study linked Internal Revenue Service (IRS) income tax data at the household level for all eighth-graders in one California public school district and one Oregon public school district. The study looked to explain the residual in achievement for eighth-grade English language arts (ELA) exam scores. After controls for covariates such as race, nativity, and language, the study concluded that FRPLE had significant predictive power related to ELA exam scores. Cruse and Powers (2006) used FRPLE data to identify whether FRPLE counts are a good predictor of school area poverty. School area poverty data are from the Small Area Income and Poverty Estimates (SAIPE). Although there was a positive relationship between FRPLE and school area poverty estimates from SAIPE, their findings were sufficiently noisy to conclude that their study could not use FRPLE to predict school district poverty accurately.
Nicholson et al. (2010) evaluated the use of FRPLE as a measure of socioeconomic status. Socioeconomic status was a measurement constructed through a series of community-based metrics. The goal was to discern whether FRPLE is a meaningful proxy for socioeconomic status.[7] Data are from a nationally representative sample of public high schools in 2010. The study found that the percentage of students eligible for free or reduced-price lunch was related to the identified community-based measurements for socioeconomic status.
To my knowledge, the most recent study assessing the accuracy of FRPLE in the wake of CEP is by Kodel and Parsons (2021). The authors use administrative microdata from Missouri to assess whether the adoption of CEP has eroded the ability of FRPLE to capture student disadvantage. The authors find that the adoption of CEP has had virtually no effect on students at the individual level, with “modest” levels of eligible students no longer being represented in FRPLE counts after CEP. However, there is a “meaningful” relationship at the school level that distorts the pre-CEP value of FRPLE. Suppose schools are above the 40 percent threshold for direct certification. In that case, the authors estimate that in the absence of CEP, the school would have roughly 79 percent of their students as the share of students represented by FRPLE counts.
VI. Data
I present summary statistics for the key variables used in my primary analysis in Table 1. Data for FRPLE and direct certification counts at the school level for 2017 – 18, 2015 – 16, and 2014-15 are from the Lunch Program Eligibility file within the Common Core of Data (CCD) Public Elementary/Secondary School Universe (PSU) Survey data. All individual schools are collapsed by their district identification number so that each observation represents an individual school district. Total student counts, Latinx student counts, and white student counts are from the 2017-18, 2015 – 16, and 2014-15 Membership file from the PSU.
Student counts by race/ethnicity are from the Membership file and not from the Lunch Program Eligibility file because race/ethnicity counts are not available within the Lunch Program Eligibility file. The data for my primary analysis are from 2017 – 18. I use CCD PSU data from 2015 – 16 and 2014 – 15 predominately to impute FRPLE shares for districts from states no longer reporting FRPLE. I remove all districts from the United States Territories and districts with missing values for the number of students qualifying for free or reduced-price lunch, the number of Latinx students, or the number of students in poverty from my primary sample. I also remove school districts reporting zero percent of students eligible for free or reduced-price lunch. I recode school districts reporting over 100 percent of their students qualifying for free or reduced-price lunch to 100 percent.

Data for the share of school-aged children in poverty are from the 2017 Small Area Income and Poverty Estimates (SAIPE) program. SAIPE data are from administrative tax return data, SNAP, the decennial census, the postcensal population estimates, and the American Community Survey (ACS) (U.S. Census Bureau, 2020a; U.S. Census Bureau, 2020b). SAIPE data, particularly for school districts, use the ACS 5-year poverty estimate, IRS tax data, and “the most recent up-to-date” school boundaries from the Census Bureau’s School District Review Program (SDRP) (U.S. Census Bureau, 2020a; U.S. Census Bureau, 2020b).
School districts from SAIPE were identified in the 2017 school district mapping survey (U.S. Census Bureau, 2020a; U.S. Census Bureau, 2020b). The 2017 school district mapping survey began on January 1, 2018 and used school district boundaries for the 2017 – 18 school year (U.S. Census Bureau, 2020a; U.S. Census Bureau, 2020b). SAIPE constructs an estimate for the number of school-aged children in poverty at the school district level based on county-level poverty estimates (U.S. Census Bureau, 2020a; U.S. Census Bureau, 2020b). The within-county poverty estimates are estimated with the combination of poverty shares from the long-form sample data from previous years and the current poverty shares from federal individual income tax returns (U.S. Census Bureau, 2020a; U.S. Census Bureau, 2020b). The veracity of SAIPE poverty estimates at the school district level is contingent on the degree to which county-level tax returns can be assigned to specific school districts within each county (U.S. Census Bureau, 2020a; U.S. Census Bureau, 2020b). SAIPE data are noisy and can be less representative for smaller, more rural school districts with smaller total populations (U.S. Census Bureau, 2020a; U.S. Census Bureau, 2020b).
SAIPE provides poverty estimates for all school districts in the Census Bureau's Topologically Integrated Geographic Encoding and Referencing (TIGER) program, which is updated through the School District Review Program (SDRP) (U.S. Census Bureau, 2020a; U.S. Census Bureau, 2020b). There are a total of 12,710 school districts in the sample I use in my primary analysis. Approximately 96.1 percent of all districts in SAIPE were successfully merged with data from the CCD PSU.
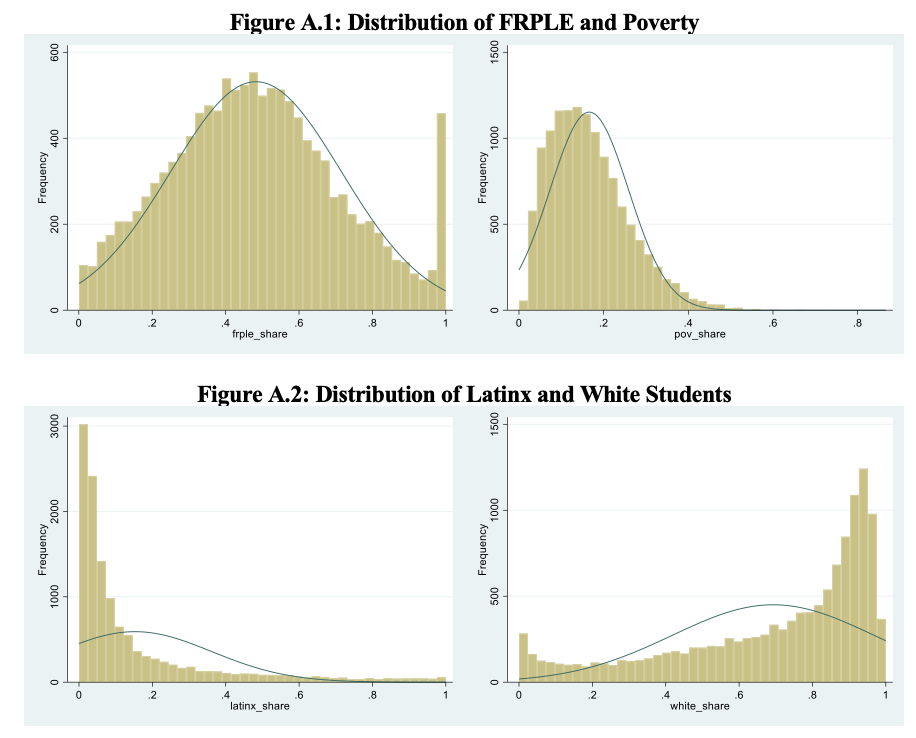
A central part of my analysis depends on the percentile or percent cutoff I use to define districts with a large share of Latinx or white students. For example, a school district defined at the 95th percentile cutoff for Latinx has a share of Latinx students within the 95th percentile of all school districts in my sample. A school district with a large share of Latinx students defined at the 95 percent cutoff has a student body that is more than 95 percent Latinx. Table 2 presents descriptive statistics for the distribution of school districts according to percentile and percent cutoffs. Column (2) in Table 2 presents the percentage of students at the district level that corresponds to the percentile cutoff. Appendix Figure 1 and Appendix Figure 2 visually presents the distribution of the share of students eligible for free or reduced-price lunch and the share of school-aged children in poverty.

Table 3 presents a comprehensive descriptive statistics table broken down by percentile and percent cutoffs according to the share of Latinx or white students. Column (1) and column (2) present the mean of the share of school-aged children in poverty and the standard deviation, respectively. Column (3) and column (4) present the mean of the share of students eligible for free or reduced-price lunch and the standard deviation, respectively. Column (4) and column (5) present the mean of the share of students eligible for free or reduced-price lunch through direct certification and the standard deviation, respectively.


VII. Methods
I use multiple ordinary least squares (OLS) regression estimates to identify the relationship between school districts with a large share of Latinx students on FRPLE while controlling for the share of Latinx students and the share of school-aged children in poverty. My primary specification is a state-level fixed-effects model. I use several other regression models to estimate coefficients as comparisons and for robustness checks.
The most important variable in my analysis is the interaction term for the share of school-aged children in poverty and an indicator variable equal to one for school districts defined as having a large share of Latinx students. The share of school-aged children in poverty is used as another proxy for disadvantage. Thus, the interaction is the estimated level of disadvantaged students at the district level.
Methods Used for Primary Analysis
My primary model and specification is a state-level fixed-effects model estimated in Equation [1] . The dependent variable is frpleᵈᵗ which is the share of students for district d in year t, where t equals 2017 – 18, that are reported as being eligible for free or reduced-price lunch. The share of school-aged children in poverty for district d in year t is povshareᵈᵗ . The variable Latinxᵈᵗ for district d in year t represents the share of Latinx students. highLatinxᵈᵗ for district d in year t is an indicator variable equal to one for school districts with a large share of Latinx students. The default cutoff for a school district with a large share of Latinx students is the 95th percentile. (highLatinxᵈᵗ x povshareᵈᵗ) is an interaction term between the share of school-aged children in poverty for district d in year t and the indicator variable for highLatinxᵈᵗ. I include state-level fixed effects, ᵧst for state st to account for any differences that may vary systematically by state. Equation [1] allows me to estimate the relationship between school districts with a large share of Latinx students and the share of students eligible for free or reduced-price lunch while controlling for the share of Latinx students and the share of school-aged children in poverty.

I estimate Equation [2] for my primary analysis to compare the relationship between disadvantaged school districts with a large share of Latinx students to disadvantaged school districts with a large share of white students. Equation [2] has the same functional form as Equation [1]. The variable whiteᵈᵗ for district d in year t in Equation [2] represents the share of white students. highWhiteᵈᵗ for district d in year t is an indicator variable equal to one for school districts with a large share of white students. The default cutoff for a school district with a large share of white students is the 95th percentile. (highWhiteᵈᵗ x povshareᵈᵗ) is an interaction term between the share of school-aged children in poverty for district d in year t and the indicator variable for highWhiteᵈᵗ.

The relationship between the share of school-aged children in poverty and the share of students eligible to receive free or reduced-price lunch is nonlinear. Due to the non-linearity, I use a cubic regression model to generate the average marginal effect (AME) at the mean for the relationship between the share of school-aged children in poverty and the share of students eligible for free or reduced-price lunch. The cubic model fits the data more closely than a linear, quadratic, or quartic model. While the cubic model most closely fits the data, I present estimates to the quartic polynomial for the share of school-aged children in poverty. I use the estimated AME from Equation [3] as another way to compare the estimates from Equation [1] and Equation [2].

Methods Used for Robustness Checks, Sensitivity Analysis, and Heterogeneity
The District of Columbia (DC), Delaware (DE), Massachusetts (MA), Tennessee (TN), and West Virginia (WV) do not report FRPLE counts at the state level and solely report direct certification counts in 2017-18 (NCES, 2020). DC, DE, TN, and WV last reported FRPLE counts at the state level in 2015 – 16. MA last reported FRPLE counts at the state level in 2014 – 15. The NCES reports FRPLE percentages at the state level for 2017 – 18 with imputations for FRPLE from the last year each state reported FRPLE counts (NCES, 2020). The sample of school districts I use for my primary analysis includes the same imputations the NCES implemented and recodes for school districts reporting over 100 percent FRPLE. As a robustness check, I replicate the estimates from my primary specification without imputations and without recoding FRPLE over 100 percent.
I conduct multiple sensitivity tests for the estimates in my primary specification. The default cutoff defining whether a school district has a large share of Latinx or white students is the 95th percentile for the distribution of Latinx students and white students, respectively. For the sensitivity tests, I change the defining cutoff for whether a school district has a large share of Latinx or white students. Percentile cutoffs are used in addition to percent cutoffs in case relative whiteness or non-whiteness plays a role.
I test for heterogeneity across quantiles (τ) of the share of students eligible for free or reduced-price lunch. I estimate Equation [4] and Equation [5] for the quantile regressions I use to test for heterogeneity. Quantile regressions estimate the relationship from my primary specification but at each quantile (τ) of students eligible for free or reduced-price lunch.

I estimate Equation [6], Equation [7], Equation [8], and Equation [9] as robustness checks for my hypothesis and conceptual framework. Understanding why schools may be underreporting Latinx students in FRPLE counts is essential. However, the central question I hope to answer is, are Latinx students underrepresented in FRPLE counts. Not, why are Latinx students underrepresented in FRPLE counts. Thus, I do not discuss Equation [6], Equation [7], Equation [8], and Equation [9] in my results section. Understanding why Latinx students may be underrepresented in FRPLE counts is important, and the estimated coefficients are presented in Appendix Table 4 and Appendix Table 5 to provide additional context and to motivate future research.
Equation [6] estimates the relationship between school districts with a large share of Latinx students and the share of students eligible for free or reduced-price lunch through direct certification while controlling for the share of Latinx students and the share of school-aged children in poverty. Equation [7] estimates the relationship between school districts with a large share of white students and the share of students eligible for free or reduced-price lunch through direct certification while controlling for the share of white students and the share of school-aged children in poverty. Thus, the dependent variable directcertᵈᵗ in Equation [6] and Equation [7] is the share of students for district d in year t that are reported as being eligible for free or reduced-price lunch through direct certification.

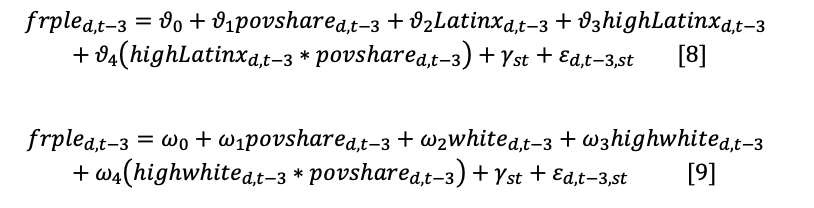
Equation [8] and Equation [9] closely resemble Equation [1] and Equation [2], respectively. The only difference between the two sets of equations is Equation [1] and Equation [2] are in year t where t equals 2017 – 18. Equation [8] and Equation [9] are in year t−3 where t−3 equals 2014 – 15, the first year CEP was made available to states, schools, and school districts nationally.
VIII. Results from Primary Analysis
Table 4 presents my estimates for the average marginal effect at the mean between the share of school-aged children in poverty and FRPLE estimated in Equation [3]. Column (1) in Table 4 is the raw correlation between the share of school-aged children in poverty and FRPLE. I include state-level fixed effects in column (2) and leave the share of school-aged children in poverty as the only regressor. Each column after column (2) in Table 4 gradually includes higher-order terms for the share of school-aged children in poverty with state-level fixed effects. Thus, column (3) includes the quadratic for the share of school-aged children in poverty, column (4) includes the cubic, and column (5) includes the quartic. I use Ramsey’s Regression Specification Error Test (RESET) to test the specification in each column. RESET is an accepted method used to evaluate regression functional form misspecification (Wooldridge, 2013). A large and statistically significant F-statistic suggests a functional form misspecification (Wooldridge, 2013).
I present the estimates from my primary regression specification in Table 5. Column (6) in Panel A presents my estimates from Equation [1], and column (6) in Panel B presents my estimates from Equation [2]. Column (1) in Table 5 presents the raw correlation between the share of school-aged children in poverty and FRPLE. Column (2) presents estimates for the raw correlation in column (1) with state-level fixed effects. Each column after column (2) gradually includes additional regressors to the specification in column (1) until Equation [1] is estimated in Panel A, and Equation [2] is estimated in Panel B.
Estimated Average Marginal Effect from Cubic Regression
I use the cubic regression model in Equation [3] to more closely estimate the relationship between the share of school-aged children in poverty and the share of students eligible to receive free or reduced-price lunch. I present my estimates up to the quartic polynomial of the share of school-aged children in poverty in Table 4. The RESET F-statistic for the linear raw correlation with state-level fixed effects in column (2) is 430.02, while the RESET F-statistic for the cubic regression specification in column (4) is 8.05. Both F-statistics are statistically significant, but the size of the F-statistic for the specification in column (2) indicates a greater degree of unidentified nonlinearity relative to the cubic specification in column (4) (Wooldridge, 2013). Appendix Figure 3 presents scatter plots with the fitted regression line for each specification presented in Table 4.
The estimates for the cubic specification in Table 4 indicates that the AME at the mean for a 0.01 (1.0 percentage point) increase in the share of school-aged children in poverty is related to a 2.15 percentage point increase in the share of students eligible for free or reduced-price lunch at the school district level. The coefficient for the raw correlation with state-level fixed effects in column (2) is 1.72.

Estimated Relationship Between Poverty and FRPLE by Race/Ethnic Composition of School Districts
My primary regression specification is presented in Panel A of Table 5. My primary specification estimates the relationship between school districts with a large share of Latinx students and the share of students eligible for free or reduced-price lunch while controlling for the share of Latinx students and the share of school-aged children in poverty locally. Column (6) in Panel A of Table 5 presents the estimates of my primary specification estimated in Equation [1]. Panel B of Table 5 shows the same relationship as Panel A, but for school districts with a large share of white students. Thus, Panel B of Table 5 presents the relationship between school districts with a large share of white students and the share of students eligible for free or reduced-price lunch while controlling for the share of white students and the share of school-aged children in poverty locally. Column (6) in Panel B of Table 5 presents the estimates for Equation [2].
The cutoff for a school district with a large share of Latinx students or a large share of white students in Table 5 is the 95th percentile. Under each column number, the cutoff defining a school district with a large share of Latinx or white students is noted. Thus, “P95” under the column numbers in Panel A of Table 5 indicates that the 95th percentile cutoff defines a school district with a large share of Latinx students. Table 2 and Table 3 present descriptive statistics for each cutoff.
Column (1) presents the raw correlation between the share of school-aged children in poverty and the share of students at the district level eligible for free or reduced-price lunch. Column (2) presents the raw correlation with state-level fixed effects. I include state-level fixed effects to control for any state-specific variation. Each column after column (2) gradually includes additional regressors to the specification in column (1). Column (3) in Panel A includes the share of Latinx students at the school district level. Column (4) includes an indicator variable equal to one for school districts with a large share of Latinx students. Column (5) includes an interaction term for the share of school-aged children in poverty and the indicator variable for school districts with a large share of Latinx students. The indicator variable allows me to interpret the relationship between the share of school-aged children in poverty for school districts with a large share of Latinx students relative to school districts that do not have a large share of Latinx students. Column (6) includes state-level fixed effects and presents estimates for my primary specification estimated in Equation [1].
Thus, controlling for the share of school-aged children in poverty locally and the share of Latinx students in the school district, each 0.01 (1.0 percentage point) increase in the share of school-aged children in poverty is associated with 0.46 percentage point more students reported eligible for free or reduced-price lunch in high Latinx districts (HLDs). The term HLDs refers to the fully estimated coefficient for school districts with a large share of Latinx students after incorporating the interaction term.
The coefficient for HLDs in column (6) of Panel A is derived from the estimated coefficient for the share of school-aged children in poverty and the coefficient for the interaction term for the share of school-aged children in poverty and the indicator variable for school districts with a large share of Latinx students. Subsequent analyses for all other estimated coefficients follow the same interpretation for the estimated coefficients in column (6) of Panel A for Table 5.

Column (6) of Panel B in Table 5 presents estimates for Equation [2]. Thus, controlling for the share of school-aged children in poverty locally and the share of white students in the district, each 0.01 (1.0 percentage point) increase in the share of school-aged children in poverty is associated with 1.22 percentage point more students reported eligible for free or reduced-price lunch in high white districts (HWDs). The term HWDs refers to the fully estimated coefficient for school districts with a large share of white students after incorporating the interaction term.
The estimated coefficient for HLDs is roughly 62.3 percent less than the estimated coefficient for HWDs, roughly 72.7 percent less than the estimated coefficient for non-HLDs (HLDs=0), roughly 73.3 percent less than the raw correlation with state-level fixed effects in column (2), and roughly 78.6 percent less than the estimated AME. Figure 1 presents the estimated coefficients and predicted FRPLE share at the margins for HLDs and HWDs for the specification in column (6) in Table 5. Thus, the relationship in Figure 1 controls for the share of students by race/ethnicity, and the share of school aged children in poverty. The Y-axis is the predicted value for the share of free or reduced-price lunch at the margins, and the X-axis is the share of school-aged children in poverty.

The panel on the left-hand side of Figure 1 is the relationship for HLDs. The panel on the right-hand side of Figure 1 is for HWDs. The blue line for the panel on the left is for school districts not defined as HLDs (HLDs=0), while the red line is for school districts defined as HLDs (HLDs=1). Moving across the X-axis indicates an increase in the share of school-aged children in poverty. As the share of school-aged children in poverty increases, the predicted FRPLE at the margins does not change a great deal for HLDs. However, the blue line for non-HLDs (HLDs=0) seems to increase almost proportionally to the share of school-aged children in poverty. The panel on the right-hand side of Figure 1 presents the same relationship but for HWDs. Figure 1 seems to show that an increase in the share of disadvantaged students in school districts, with a large share of Latinx students, does not correspond to large/proportional increases in FRPLE at the margins. Alternatively, increases in the share of disadvantaged students in school districts, with a large share of white students, does seem to correspond to large/proportional increases in FRPLE at the margins.
IX. Results from Robustness Checks, Sensitivity Analysis, and Heterogeneity
Sensitivity Analysis
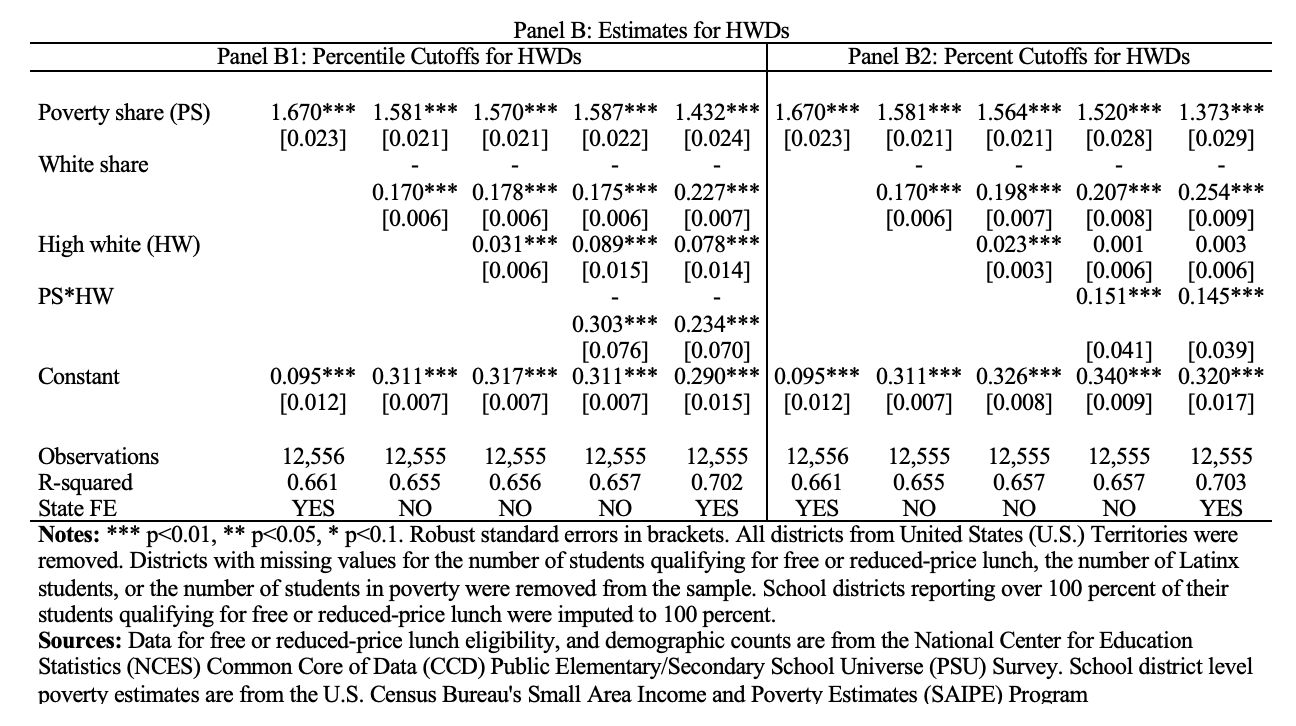
Sensitivity analyses for HLDs and HWDs presented in Table 6 and Table 7 allow me to assess how sensitive my estimates are to different cutoffs for what constitutes a school district with a large share of Latinx or white students. Panel A1 in Table 6 presents estimates for my primary specification estimated in Equation [1] at different percentile cutoffs. Panel A2 in Table 6 presents estimates for my primary specification in Equation [1] without state level fixed effects at different percentile cutoffs. Panel B in Table 6 presents estimates for Equation [2] at different percentile cutoffs.
The cutoff for a school district with a large share of Latinx students or a large share of white students in Table 6 is noted under each column number. Thus, “P99” under the column numbers in Panel A1 of Table 6 indicates that the 99th percentile cutoff defines a school district that has a large share of Latinx students. Table 2 and Table 3 present descriptive statistics for each cutoff.
The estimated coefficient for HLDs at the 99th percentile cutoff in column (1) of Panel A1 is 0.12 and 1.16 at the 75th percentile cutoff in column (6) of Panel A1. The estimated coefficient for HWDs at the 99th percentile cutoff in column (1) of Panel B is 1.27 and 1.52 at the 75th percentile cutoff in column (6) of Panel B.

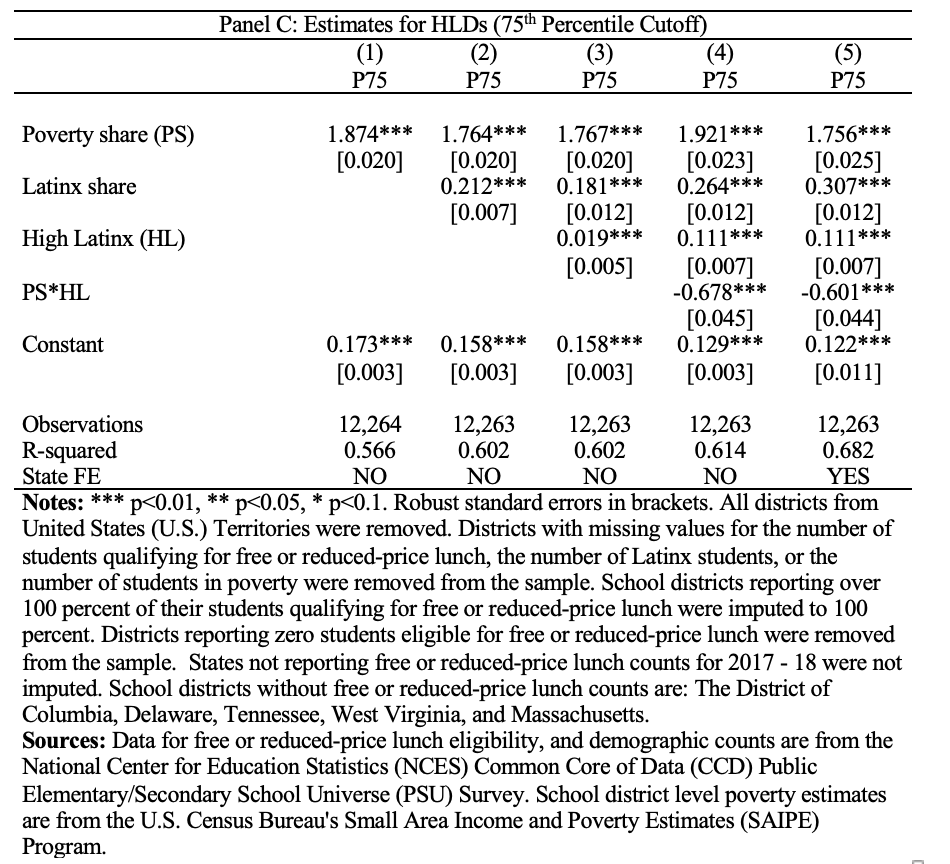
Panel A in Table 7 presents estimates for my primary specification estimated in Equation [1] at different percent cutoffs, and Panel B in Table 7 presents estimates for Equation [2] at different percent cutoffs. The cutoff for a school district with a large share of Latinx students or a large share of white students in Table 7 is noted under each column number. Thus, “99 (%)” under the column numbers in Panel A of Table 7 indicates that the 99 percent cutoff defines a school district that has a large share of Latinx students. Table 2 and Table 3 present descriptive statistics for each cutoff. The estimated coefficient for HLDs at the 99 percent cutoff in column (1) of Panel A is 0.18 and 0.35 at the 75 percent cutoff in column (6) of Panel A. The estimated coefficient for HWDs at the 99 percent cutoff in column (1) of Panel B is 1.18 and 1.65 at the 75 percent cutoff in column (6) of Panel B. Figure 2 presents the estimated coefficients and the predicted FRPLE share for HLDs and HWDs for the 90 percent cutoff in column (3) of Table 7.


Robustness Checks
Robustness checks for the sample used in the estimates presented in column (6) of Panel A in Table 5 are provided in Appendix Table 1, Appendix Table 2, and Appendix Table 3. The three appendix tables present estimates for Equation with alternative samples.
Appendix Table 1 omits imputations for the share of students eligible for free or reduced-price lunch in states no longer reporting FRPLE. Five states/districts (DC, DE, TN, WV, MA) no longer report FRPLE at the state level (NCES, 2020). There are 501 imputed school districts from the five states/districts included in the sample of school districts used for my primary analysis. The 501 districts represent about 3.9 percent of all districts in my primary sample. I include the specified imputations because the NCES includes the same imputations when reporting FRPLE at the state level (NCES, 2020). The NCES imputes the five states/districts no longer reporting FRPLE with the last year they did report FRPLE. The last year DC, DE, TN, and WV reported FRPLE was in 2015 – 16. The last year MA reported FRPLE was in 2014 – 15. However, since imputations come from previous years, older FRPLE counts could bias my primary estimates if they are correlated with time-variant factors.
Appendix Table 2 removes school districts reporting 100 percent or more FRPLE but keeps the imputations for the FRPLE shares for school districts in DC, DE, TN, WV, and MA. Appendix Table 3 omits state imputations and school districts reporting 100 percent or more FRPLE. There have been reports that some schools and school districts participating in CEP will report 100 percent FRPLE once they cross the 40 percent ISP direct certification threshold for CEP (Greenberg et al., 2009). In my sample of 12,710 school districts, 133 districts (1.05 percent) reporting at least 40 percent of their students eligible for free or reduced-price lunch through direct certification report 100 percent or more FRPLE.
Schools and school districts participating in CEP are encouraged to identify more students beyond the 40 percent threshold if they exist within their student body. The USDA calculates reimbursement rates by multiplying the percentage of identified students by a 1.6 multiplier (USDA, 2017). For example, if a school or school district identifies 62.5 percent of students as qualifying for free or reduced-price lunch through direct certification, the school's reimbursement rate would be 100 percent for all subsidized meals. Thus, the USDA incentivizes schools to report up to the 62.5 percent mark. If schools or school districts are overreporting FRPLE counts, it may be more likely that over-reporting districts have reached the 62.5 percent incentive threshold.
In my sample, 48 districts (0.38 percent) reporting at least 62.5 percent of their students eligible for free or reduced-price lunch through direct certification report 100 percent or more FRPLE. Thus, bias in my primary estimates, without the robustness checks, due to over-reporting would likely be small. However, since I calculate the share of students at the district level by aggregating school level counts, FRPLE over 100 percent at the district level may indicate potentially significant over-reporting at the individual school level. Overall, 295 districts (2.32 percent) in the sample used for my primary analysis report 100 percent or more FRPLE.
Estimates presented in Appendix Table 1, Appendix Table 2, and Appendix Table 3 are qualitatively similar to the estimates for my primary specification in column (6) of Panel A in Table 5. The estimated coefficient for my primary specification in column (6) of Panel A in Table 5 is 0.46. The estimated coefficients for my primary specification in column (5) of Panel A in Appendix Table 1, Appendix Table 2, and Appendix Table 3 are also 0.46. Thus, the estimates for my primary specification seem to be robust across alternative samples.
Test for Heterogeneity
I present the quantile regression estimates for Equation [4] and Equation [5] in Table 8. I use quantile regressions as a test for heterogeneity across the distribution of FRPLE among school districts. The quantile regression estimates presented in Panel A1 of Table 8 are for Equation [4]. Panel A2 presents estimates for Equation [4] without state-level fixed effects, and Panel B of Table 8 presents estimates for Equation [5]. Column (1) in Panel A of Table 8 presents the estimates for Equation [1], and Column (1) in Panel B of Table 8 presents the estimates for Equation [2]. Each column after column (1) presents the estimates for the next quantile. Thus, column (2) presents estimates for the distribution of FRPLE at the 15th percentile, column (3) for the 25th percentile, column (4) for the 50th percentile, column (5) for the 75th percentile, and column (6) for the 85th percentile.
The estimated coefficient for HLDs at the lowest quantile in Panel A1 is 0.49. The estimated coefficient for HLDs at the median is 0.53, and the estimated coefficient for the highest quantile is 0.32. Thus, the percentage point increase in FRPLE for HLDs is lower for HLDs in the highest quantile of FRPLE than the lowest quantile. The estimated coefficient for HWDs at the lowest quantile in Panel C is 1.32, 1.29 at the median, and 1.35 at the highest quantile. Heterogeneity across the distribution for FRPLE for HLDs and HWDs seems qualitatively small, with a slightly greater degree of heterogeneity for HLDs.


Thus, while controlling for the share of school-aged children in poverty, each 0.01 (1.0 percentage point) increase in the share of school-aged children in poverty while controlling for the share of Latinx students is related to a lower percentage point increase in FRPLE for HLDs with the most children eligible for free or reduced-price lunch compared to HLDs with the least children eligible for free or reduced-price lunch. The estimated coefficient for HLDs in the highest quantile is 34.7 percent less than the estimated coefficient for HLDs in the lowest quantile. Alternatively, the estimated coefficient for HWDs in the highest quantile is 102.3 percent of the estimated coefficient for HWDs in the lowest quantile.
Estimated coefficients for my primary specification seem to be robust across quantiles of FRPLE. At each quantile of FRPLE, the estimated coefficient for HLDs is still less than half of the estimated coefficient for HWDs. Further exploration into the heterogeneity for HLDs is outside of the scope of my analysis but may warrant future research.
X. Discussion
Free or reduced-price lunch eligibility (FRPLE) is frequently used as a proxy for disadvantage by researchers and by states and school districts when allocating school-level funding. Using FRPLE to allocate school-level funding to the most disadvantaged students is a reasonable choice given the absence of any alternative. States can use SAIPE or administrative data to allocate funding to districts, but districts do not have many alternatives beyond FRPLE. FRPLE is an accessible measurement based on mostly self-reported household income. However, more students every year are qualifying for free or reduced-price lunch with more schools and school districts participating in CEP.
Additionally, the systematic under-enrollment of Latinx families in public benefit programs (Pino, 2020) may result in FRPLE failing to capture disadvantaged Latinx students. Thus, the reported FRPLE counts are unlikely to be the true FRPLE counts or a true measure of all disadvantaged students. My study is the first to my knowledge to estimate the relationship between FRPLE and Latinx students while controlling for the share of school-aged children in poverty. I find that the estimated coefficient for high Latinx districts (HLDs) is roughly 62.3 percent less than the estimated coefficient for high white districts (HWDs), roughly 72.7 percent less than the estimated coefficient for non-HLDs (HLDs=0), roughly 73.3 percent less than the raw correlation with state-level fixed effects, and roughly 78.6 percent less than the estimated AME. My estimates are robust to various sample restrictions and I find evidence of heterogeneity for HLDs across different quantiles of FRPLE.
Since researchers, states, schools, and school districts use FRPLE as a measure of disadvantage, I use the share of school-aged children in poverty from SAIPE as an alternative measure of disadvantage. Data from SAIPE are used as an initial baseline to estimate how another potential measure of disadvantage, in the form of school-aged children in poverty, is related to FRPLE. I use SAIPE data to identify the overlap of Latinx students at the school district level in poverty.
My primary regression specification estimates resemble the findings from previous research exploring the relationship between FRPLE and where it may come up short. (Kodel and Parsons, 2021; Domina et al., 2018; Michelmore and Dynarski, 2017; Nicholson et al., 2014). The general conclusion seemingly agreed upon by most studies is that the observed FRPLE counts reported by schools are unlikely to be the true unobserved FRPLE counts had all eligible students registered. While no other study looks explicitly at FRPLE and Latinx students while controlling for the share of school-aged children in poverty, my estimates suggest that reported FRPLE counts are unlikely to reflect the true FRPLE counts. Specifically, my findings suggest that FRPLE may not capture all disadvantaged students and seem to strongly support the statement that reported FRPLE counts vary systematically with Latinx students when controlling for the share of school-aged children in poverty. Other studies (Pino, 2020; Watson, 2014; Hanson, 2014, Hanson et al., 2014) have found evidence that SNAP and other public benefit programs systematically fail to represent all eligible Latinx families and lend support to the veracity of my estimates.
Although all my estimates are statistically significant at the one percent level and resemble estimates from the literature, my estimates are still descriptive and likely suffer from some degree of bias. I use previous years of FRPLE and alternative samples excluding non-reporting states to avoid potential bias. However, there may still be systematic and unobserved differences unaccounted for from non-reporting states.
Furthermore, SAIPE does not link to individual children attending schools from the Common Core of Data (CCD) FRPLE counts. SAIPE data estimates all school-aged children in poverty in a geographic area linked to individual school districts. School-aged children that are homeschooled, in private school, in schools outside of the CCD Public Elementary/Secondary School Universe Survey (PSU), or not enrolled in school would be reflected in SAIPE data. Thus, estimates from SAIPE do not link directly to specific students in individual school districts.
Additional concerns stem from the reliability of the data from the CCD. Since the CCD relies on schools to report the number of Latinx students, schools misreporting Latinx students may bias results. However, given the different robustness checks and statistical significance of the coefficients, potential misreporting does not seem likely to vary systematically with FRPLE in a way that would significantly bias my estimates. Other school-level characteristics that may also contribute to FRPLE counts, such as the school's culture or staff tenacity to enroll eligible students, are not reflected in my estimates. Although there is an abundance of research documenting the under-enrollment of Latinx families in public benefit programs, the data do not permit me to explicitly identify Latinx students that qualify for free or reduced-price lunch that the school has not identified within their reported FRPLE counts.
FRPLE counts are important for school-level funding, especially when districts allocate funds to schools serving the most disadvantaged students (Skinner and Aussenberg, 2016). Understanding which students might be excluded from reported FRPLE counts is essential for allocating school-level funding. My baseline analysis presents estimates of the relationship between SAIPE and FRPLE. The baseline estimates help quantify the relationship between the two as potential proxies for disadvantage. The estimates from my primary regression specification go a step further by exploring the relationship between the under-enrollment of Latinx families in public benefit programs while controlling for another measure of disadvantage (school-aged children in poverty). Thus, the relationship from my primary regression specification could be valuable for informing public policy. Since my estimates are descriptive relationships, any policy motivated by my findings should be modest. However, my analysis shows that disadvantaged school districts with a large share of Latinx students may be inadvertently underreporting their FRPLE counts or struggling to identify and enroll all eligible students.
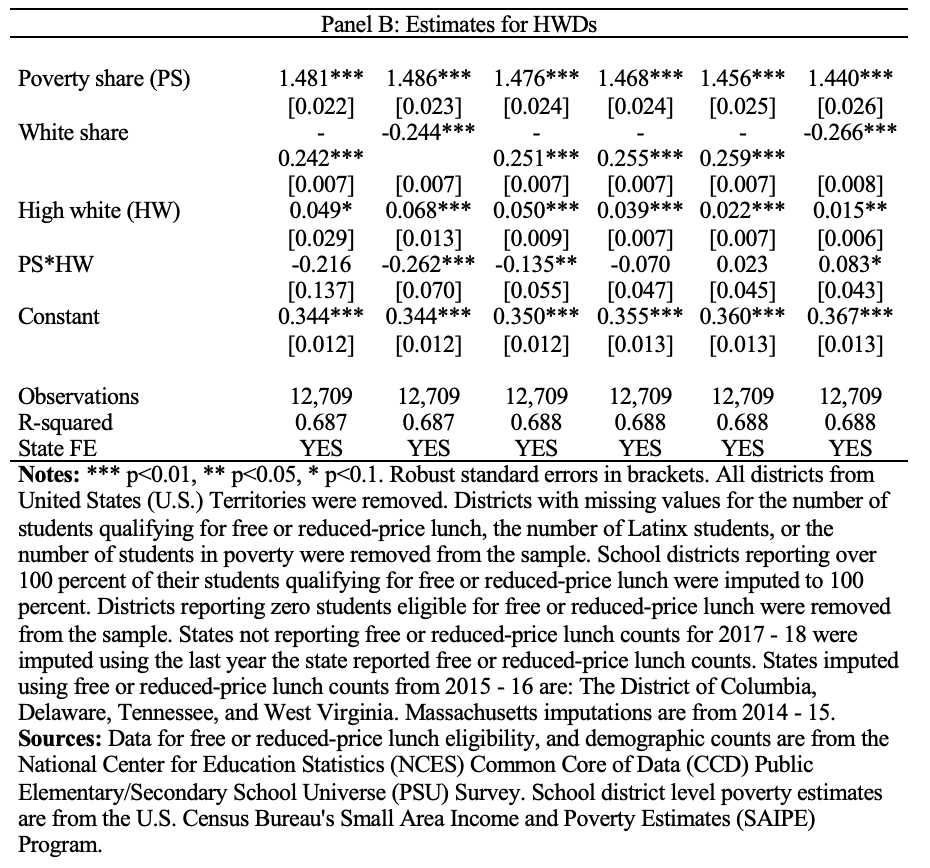
Estimated coefficients presented in Appendix Table 4 and Appendix Table 5 are not central to this analysis but present evidence indicating that Latinx students are unlikely to be underrepresented in FRPLE counts solely because of CEP. At the 95th percentile cutoff, the estimated coefficient for HLDs in 2014 – 15 (the first year CEP was available nationally) is roughly 54 percent less than the estimated coefficient for HWDs. Also, controlling for the share of school-aged children in poverty locally and the share of Latinx students in the district in 2017 - 18, each 0.01 (1.0 percentage point) increase in the share of school-aged children in poverty is associated with 0.07 percentage point more students reported eligible for free or reduced-price lunch through direct certification for HLDs. However, there is no statistically significant relationship for the interaction term representing HWDs. Future studies focused on a time series analysis of FRPLE may answer why Latinx students seem to be underrepresented in FRPLE counts.
My approximate estimates could lay the groundwork for more robust studies. Future studies with comprehensive administrative data may uncover the true extent to which FRPLE represents all eligible students and how that may vary systematically with school districts with a large share of Latinx students. The goal of such a study would be to explicitly identify Latinx students that qualify for free or reduced-price lunch that the school has not identified within their FRPLE counts.
Simple policies encouraging staff from school districts with a large share of Latinx students to make information regarding FRPLE readily accessible to all families or implementing basic practices for increasing school meal application take-up would be reasonable responses. Cost-effective strategies include reminding parents with robocalls, using social media to engage students, making applications available at community-based sites, or providing small monetary/non-monetary incentives (Food Resource & Action Center, 2021).
XI. Appendix


+ Author biography
+ Footnotes
[1] The term Free or reduced-price lunch eligibility (FRPLE) refers to the US Department of Agriculture (USDA) school meal programs offered through the National School Lunch and School Breakfast Programs (NLSP). Thus, the term free or reduced-price lunch and FRPLE refer to all subsidized meals offered through the NSLP.
[2] I refer to socioeconomic disadvantage as disadvantage from this point on.
[3] I use the term Latinx instead of Hispanic. Latinx students in my data are classified as Hispanic by the National Center for Education Statistics (NCES) within the Common Core of Data (CCD) Public Elementary/Secondary School Universe (PSU) Survey.
[4] Households eligible for unemployment or the Special Supplemental Nutrition Program for Women, Infants, and Children (WIC) may also be eligible for free or reduced-price meals (USDA, 2021).
[5] Distinct forms of disadvantage refer to students that are classified as being a foster, migrant, homeless, or runaway youth.
[6] Federal Child Nutrition Programs (CNP) are not subject to Title IV of the Personal Responsibility and Work Opportunity Reconciliation Act (PRWORA) of 1996. Title IV of PRWORA restricts access to some welfare programs based on an individual's citizenship status.
[7] Community socioeconomic status (SES) includes household median income, the percent of families below the poverty line, the percent of families with children younger than 18 in poverty, and the percent of all households in the identified census block, used to construct the SES metric, below the poverty line.
+ References
Arteaga, Irma, Stephanie Potochnick, and Sarah Parsons. “Decomposing the Household Food Insecurity Gap for Children of U.S.-Born and Foreign-Born Hispanics: Evidence from 1998 to 2011,” Journal of Immigrant and Minority Health; New York 19 (2017), 1050–1058 (New York, Netherlands, New York, Springer Nature B.V.).
Bass, David N., “Fraud in the Lunchroom?,” Education Next, 10 (2010), 67–71.
Billings, Kara Clifford, and Aussenberg, Randy Alison. “Child Nutrition Reauthorization (CNR): An Overview,” Congressional Research Service (2021), 3.
Blagg, Kristin, Macey Rainer, and Elaine Waxman. “How Restricting Categorical Eligibility for SNAP Affects Access to Free School Meals,” Urban Institute (2019).
Castro, Raymond. “More Hispanic and Asian Children Uninsured Likely Due to Chilling Effect,” New Jersey Policy Perspective (2019), 6. Chingos, Matthew M. “No more free lunch for education policymakers and researchers,” Brookings Institute (2016).
Cookson Jr, Peter W, “Measuring Student Socioeconomic Status: Toward a Comprehensive Approach,” Learning Policy Institute (2020).
Cruse, Craig, and David Powers. “Estimating School District Poverty with Free and Reduced-Price Lunch Data,” U.S. Census Bureau (2006).
Domina, Thurston, et al. “Is Free and Reduced-Price Lunch a Valid Measure of Educational Disadvantage?,” Educational Researcher, 47 (2018), 539–555 (American Educational Research Association).
Dynarski, Mark, and Kristen Kainz. “Why federal spending on disadvantaged students (Title I) doesn’t work,” Brookings Institute 1 (2015).
Fleischhacker, Sheila, and Elizabeth Campbell. “Ensuring Equitable Access to School Meals,” Journal of the Academy of Nutrition and Dietetics 120 (2020), 893–897.
Food Research & Action Center (FRAC). “Understanding the Relationship Between Community Eligibility and Title I Funding,” (2019a).
——. “Community Eligibility: The Key to Hunger-Free Schools School Year 2018–2019,” <https: data-preserve-html-node="true"//frac.org/wp-content/uploads/community-eligibility-key-to-hunger-free-schools-sy-2018-2019.pdf> (2019b) (Jan. 29, 2021).
——. “School Meals Legislation and Funding by State,” <https: data-preserve-html-node="true"//frac.org/wp-content/uploads/state_leg_table_scorecard.pdf> (2019c) (Jan. 26, 2021).
——. “Strategies to Increase School Meal Application Returns,” <https: data-preserve-html-node="true"//frac.org/wp-content/uploads/Meal-App-Returns.pdf> (2020a) (Apr. 5, 2021).
——. “Community Eligibility: The Key to Hunger-Free Schools,” (2020b).
——. “Eliminating Unpaid Meal Fees,” (2020c), 2.
——. “School Meal Eligibility and Reimbursements,” Food Research & Action Center, (2021a) (Jan. 28, 2021).
——. “Strategies to Increase Applications for School Meals Toolkit,” <https: data-preserve-html-node="true"//frac.org/wp-content/uploads/FRAC_SchoolMealsToolkit_Jan2021.pdf> (2021b) (Apr. 4, 2021).
Fortuny, Karina, and Juan Pedroza. “Barriers to Immigrants’ Access to Health and Human Services,” US Department of Health and Human Services (2012), 19.
Franco, Carolina. “Comparison of small area models for estimation of U.S. county poverty rates of school aged children using an artificial population and a design-based simulation,” U.S. Census Bureau, (2020).
Geverdt, Douglas. “School Neighborhood Poverty Estimates Documentation,” National Center for Education Statistics, (2018). Glantz, Frederic, et al. “School lunch eligible non-participants final report: Home Economics and Household Collection,” (U.S. Department of Agriculture, 1994).
Gleason, Philip. “Direct certification in the national school lunch program expands access for children,” Journal of Policy Analysis and Management 27 (2008), 82–103.
Gleason, Philip, and John Burghardt. “The National School Lunch Program: Ensuring that Free and Reduced-Price Meal Benefits Go to the Poor,” Mathematica, <https: data-preserve-html-node="true"//www.mathematica.org/our-publications-and-findings/publications/the-national-school-lunch-program-ensuring-that-free-and-reducedprice-meal-benefits-go-to-the-poor> (2005) (Apr. 5, 2021).
Gordon, Nora, and Sarah Reber. “The Quest for a Targeted and Effective Title I ESEA: Challenges in Designing and Implementing Fiscal Compliance Rules,” RSF: The Russell Sage Foundation Journal of the Social Sciences; New York 1 (2015), 129–147 (New York, United States, New York, Russell Sage Foundation).
Gordon, Nora, and Krista Ruffini. “Schoolwide Free Meals and Student Discipline: Effects of the Community Eligibility Provision,” Education Finance and Policy, (2019), 1–50 (MIT Press).
Greenberg, Erica, “New Measures of Student Poverty,” Urban Institute, (2018).
——. “Towards an Accurate Count of Low-Income Students,” (Urban Institute, 2019).
Greenberg, Erica, et al. “Measuring Student Poverty,” Urban Institute, (2019).
Haley, Jennifer M, Kenney, et al. “One in Five Adults in Immigrant Families with Children Reported Chilling Effects on Public Benefit Receipt in 2019,” Urban Institute, (2020).
Hanson, Devlin, et al. “Low-Income Immigrant Families’ Access to SNAP and TANF,” Urban Institute (2014).
Hanushek, Eric A, et al. “Does peer ability affect student achievement?” Journal of Applied Econometrics 18 (2003), 527–544. Harwell, Michael, Brandon and LeBeau. “Student Eligibility for a Free Lunch as an SES Measure in Education Research,” Educational Researcher 39 (2010), 120–131 (American Educational Research Association).
Hauser, Robert M. “Measuring Socioeconomic Status in Studies of Child Development,” Child Development 65 (1994), 1541–1545 ([Wiley, Society for Research in Child Development]).
Hoffman, Lee. “Free and Reduced-Price Lunch Eligibility Data in EDFacts: A White Paper on Current Status And Potential Changes,” (U.S. Department of Education, 2012).
Ii, Daarel Burnette. “Districts Anxious About Plunge in Meal-Program Applicants - Education Week,” Education Week <https: data-preserve-html-node="true"//www.edweek.org/ew/articles/2020/10/28/districts-anxious-about-plunge-in-meal-program-applicants.html?cmp=soc-edit-tw> (2020) (Nov. 11, 2020).
Imberman, Scott A., and Adriana D. Kugler. “The Effect of Providing Breakfast in Class on Student Performance,” Journal of Policy Analysis and Management 33 (2014), 669–699.
Kim, Jeounghee, and Myungkook Joo. “The Effects of Direct Certification in the U.S. National School Lunch Program on Program Participation,” Journal of the Society for Social Work and Research 11 (2020), 393–413 (The University of Chicago Press).
Koedel, Cory, and Eric Parsons. “The Effect of the Community Eligibility Provision on the Ability of Free and Reduced-Price Meal Data to Identify Disadvantaged Students,” Educational Evaluation and Policy Analysis 43 (2021), 3–31 (American Educational Research Association).
Kurki, Anja, et al. “Beyond Free Lunch: Alternative Poverty Measures in Educational Research and Program Evaluation: (539922012-001),” (American Psychological Association, 2005).
Leos-Urbel, Jacob, et al. “Not just for poor kids: The impact of universal free school breakfast on meal participation and student outcomes,” Economics of Education Review, 36 (2013), 88–107. Marples, Carol Ann, and Diana-Marie Spillman. “Factors Affecting Students’ Participation In The Cincinnati,” Adolescence 30 (1995), 745 (Roslyn Heights, United States, Libra Publishers Incorporated).
Michelmore, Katherine, and Susan Dynarski. “The Gap Within the Gap: Using Longitudinal Data to Understand Income Differences in Educational Outcomes,” AERA Open, (2017) (SAGE PublicationsSage CA: Los Angeles, CA).
Mirtcheva, Donka M., and Lisa M. Powell. “Participation in the National School Lunch Program: Importance of School-Level and Neighborhood Contextual Factors,” Journal of School Health, 79 (2009), 485–494.
Moore, Quinn, et al. “Direct Certification in the National School Lunch Program: State Implementation Progress, School Year 2014-2015,” Mathematica, <https: data-preserve-html-node="true"//www.mathematica.org/our-publications-and-findings/publications/direct-certification-nslp-state-implementation-school-year-2014-2015> (2016) (Apr. 5, 2021).
Moore, Quinn, et al. “Factors Associated with School Meal Participation and the Relationship Between Different Participation Measures,” Mathematica, <https: data-preserve-html-node="true"//www.mathematica.org/our-publications-and-findings/publications/factors-associated-with-school-meal-participation-and-the-relationship-between-different-participation-measures> (2009) (Apr. 12, 2021).
National Center for Education Statistics (NCES). “Improving the Measurement of Socioeconomic Status for the National Assessment of Educational Progress: A Theoretical Foundation,” (2012). ——. “Digest of Education Statistics, 2020,” <https: data-preserve-html-node="true"//nces.ed.gov/programs/digest/d20/tables/dt20_204.10.asp> (National Center for Education Statistics, 2020) (Apr. 18, 2021).
National Forum on Education Statistics. “Forum Guide to Alternative Measures of Socioeconomic Status in Education Data Systems,” U.S. Department of Education, (2015), 61.
Nicholson, Lisa M., et al. “Validating Adolescent Socioeconomic Status: Comparing School Free or Reduced Price Lunch with Community Measures,” Spatial Demography, 2 (2014), 55–65.
Parker, Emily, and Michael Griffith. “The Importance of At-Risk Funding,” Education Commission of The States, (2016).
Pino, Lisa J. “Immigration policy and perception impacts on SNAP access and eligibility: a view from the field,” Renewable Agriculture and Food Systems 35 (2020), 416–419 (Cambridge University Press). Potamites, Elizabeth, and Anne Gordon. “Children’s Food Security and Intakes from School Meals: Final Report,” Mathematica, (2010).
Ralston, Katherine, et al. “National School Lunch Program: Background, Trends, and Issues,” U.S. Department of Agriculture, (2008).
Ramshorst, Jared P. Van. “Anti-immigrant Sentiment, Rising Populism, and the Oaxacan Trump,” Journal of Latin American Geography 17 (2018), 253–256 (University of Texas Press).
Ruffini, Krista. “Universal Access to Free School Meals and Student Achievement: Evidence from the Community Eligibility Provision,” Journal of Human Resources, (2021), 0518-9509R3.
Segal, Becca, Hewins, et al. “Community Eligibility Adoption Rises for the 2015–2016 School Year, Increasing Access to School Meals,” Center on Budget and Policy Priorities, (2016).
Skinner, Rebecca R. “State and Local Financing of Public Schools,” Congressional Research Service, (2019).
——. “ESEA: Title I-A Poverty Measures and Grants to Local Education Agencies and Schools,” Congressional Research Service, (2020), 48.
Skinner, Rebecca R, and Randy Alison Aussenberg. “Overview of ESEA Title I-A and the School Meals’ Community Eligibility Provision,” Congressional Research Service (2016).
Snyder, Thomas, et al. “Study of the Title I, Part A Grant Program Mathematical Formulas Statistical Analysis Report,” National Center for Education Statistics, (2019).
Snyder, Tom, and Lauren Musu-Gillette. “Free or reduced price lunch: A proxy for poverty?,” NCES Blog, (2015).
Tegeler, Philip, and Lily Milwit. “Title I Funding and School Integration: The Current Funding Formula’s Disincentives to Deconcentrate Poverty and Potential Ways Forward,” The National Coalition on School Diversity (2019).
U.S. Census Bureau. “Estimation Strategy,” The United States Census Bureau, <https: data-preserve-html-node="true"//www.census.gov/programs-surveys/saipe/guidance/strategy.html> (2020) (Apr. 12, 2021).
——. “Quantifying Relative Error in the School District Estimates,” The United States Census Bureau, <https: data-preserve-html-node="true"//www.census.gov/programs-surveys/saipe/guidance/district-estimates.html> (n.d.) (Apr. 12, 2021a).
——. “SAIPE School District Estimates for 2017,” The United States Census Bureau, <https: data-preserve-html-node="true"//www.census.gov/data/datasets/2017/demo/saipe/2017-school-districts.html> (n.d.) (Apr. 12, 2021b).
U.S. Department of Agriculture (USDA). “National School Lunch Program: Direct Certification Continuous Improvement Plans Required by the Healthy, Hunger-Free Kids Act of 2010,” (2013a).
——. “SNAP Policy on Non-Citizen Eligibility | USDA-FNS,” <https: data-preserve-html-node="true"//www.fns.usda.gov/snap/eligibility/citizen/non-citizen-policy> (2013b) (Nov. 3, 2020).
——. “The Community Eligibility Provision (CEP): What Does It Mean For Your School or Local Educational Agency?,” (2015).
——. “Eligibility Manual for School Meals,” (2017). ——. “Community Eligibility Provision | USDA-FNS,” <https: data-preserve-html-node="true"//www.fns.usda.gov/cn/community-eligibility-provision> (2019) (Jan. 29, 2021).
Watson, Tara. “Inside the Refrigerator: Immigration Enforcement and Chilling Effects in Medicaid Participation,” American Economic Journal: Economic Policy 6 (2014), 313–338 (American Economic Association).
Waxman, Elaine, and Nathan Joo. “How Households with Children Are Affected by Restricting Broad-Based Categorical Eligibility for SNAP,” Urban Institute, (2019).
Wooldridge, Jeffrey M. “Introductory Econometrics: A Modern Approach,” (Cengage Learning, 2013).
Yu, Baeksan, et al. “Does receiving a school free lunch lead to a stigma effect? Evidence from a longitudinal analysis in South Korea,” Social Psychology of Education 22 (2019), 291–319.