The Georgetown Public Policy Review

New Fissures in the Digital Divide: Disrupting the Traditional Views on Internet Adoption

Giulia McHenry, Edward Carlson, Maureen Lewis, Rafi M. Goldberg

National Telecommunications and Information Administration (NTIA)*

Justin Goss, Celeste Chen

Georgetown University†

Abstract: Millions of Americans still do not use the Internet, and even among those who do, the speed, quality, and form of access can vary greatly. Using data from the July 2015 Computer and Internet Use Supplement to the Current Population Survey, our paper creates a more solid platform for policymakers and stakeholders to understand the contours of Internet and device use in the US. We begin by analyzing the most recent survey data on Internet non-adopters. NTIA refined its Supplement for the 2015 survey to explore in greater detail the reasons why households did not use the Internet at home. Then, we examine how various barriers to Internet usage cumulatively affect adoption among rural and urban communities. Finally, we focus on the array of computing devices available to access the Internet and the emerging disparities that have resulted based on the ability of individuals to employ these tools for particular tasks (e.g. doing homework on a smartphone as opposed to a desktop).

IMG_0125.JPG

Introduction

In the early 1990s, the discussion surrounding the digital divide focused on a binary distinction between those who accessed the Internet and those who did not. At that time, the issue largely centered around access to personal computers (PCs) and dial-up modems. In 1994, the National Telecommunications and Information Administration (NTIA) commissioned the United States Census Bureau to include supplementary questions in its Current Population Survey (CPS) focused on household usage of computers and modems.[i] NTIA issued its first report on the digital divide during the following year and has continued to study this issue over the last 20 years. Since 1994, NTIA has regularly updated and expanded the Computer and Internet Use Supplement to the CPS to gather data on types of Internet connections, online activities, device use, and other metrics.

The collective information gathered from these 20 years of reporting shows that as more Americans have gained access to the Internet and its related technologies, the digital divide has changed in important ways. As recently as March 2016, NTIA reported a narrowing of the traditional digital divide, as individual Internet use increased for senior citizens, minorities, people with disabilities, and Americans with lower levels of educational attainment (Morris 2016). Moreover, the proportion of Americans using the Internet increased steadily until 2010 and then it began to plateau at around 75 percent by 2015.[ii] Further, the number of Internet users in the United States nearly doubled from 117 million to 227 million from 2000 to 2015.

Despite these statistics indicating greater coverage, millions more still are not online (NTIA 2016). NTIA’s ongoing time-series data reveal that as usage habits and technologies change, the nature of the digital divide is evolving and other disparities have emerged. Results from the 2015 NTIA survey suggest that there is a persistent gap in users’ geographic location and an emerging gap related to their use to an assortment of Internet-enabled devices.[iii] This paper analyzes the data reflecting current trends in the digital divide. 

First, the paper’s analysis synthesizes the most recent survey data on Internet non-adopters based on refinements to the 2015 NTIA survey. For example, interviewers recorded when respondents gave multiple reasons for not using the Internet, and a new question asked whether households that reported not having home Internet service would subscribe given a lower price.

Second, the paper looks specifically at adoption in rural communities. Americans living in such communities may face a disadvantage based on the cumulative impact of various barriers to Internet use. For example, factors such as low educational attainment and race appear to be associated with lower Internet use in rural areas than in non-rural communities. 

Third, this paper then examines the array of computing devices available to access the Internet. Although the proliferation of devices means people have more alternatives for getting online, disparities could arise depending on whether an individual has access to the appropriate devices for particular tasks. Using a smartphone to access the Internet, for example, has advantages and disadvantages compared to using a laptop computer, depending on the activity. One may prefer to apply for a job on a laptop but look for directions on a tablet or mobile phone. A better understanding of this dimension requires a thorough investigation of device use, especially among those lacking complete access.

Greater connectivity to high-speed Internet is an important and widely-prioritized public policy goal. In considering the best strategies to reach this outcome, it is important to have a full, nuanced, and granular picture of the digital divide. Looking ahead, policymakers need to better understand how advances in Internet and technology use contribute to emerging aspects of an evolving digital divide. This paper aims to address these questions and point to further areas of research and study.

I. Digitally-Unconnected Americans

Whether by circumstance or choice, millions of U.S. households are not online and, thus, are unable to participate in the digital economy. In 2015, 33 million households (27 percent of all U.S. households) did not use the Internet at home, where families can more easily share Internet access and conduct sensitive online transactions privately. In 2015, one-fifth of the nation’s households (26 million) were offline entirely, lacking a single member who used the Internet from home or elsewhere. An analysis of the reasons some Americans did not use the Internet at home or elsewhere may help policymakers, as well as public and private partners, address some of the biggest obstacles to connecting the digitally unconnected. 

No Internet Use Anywhere

The 26 million U.S. households whose members did not use the Internet anywhere in the six months prior to July 2015 accounted for 21 percent of all households. In 2013, 22 million households, or 18 percent of the nation’s households, lacked anyone using the Internet at all. Comparing data from the 2013 and 2015 NTIA surveys suggests that the digital divide has expanded in some aspects. Over these two years, non-Internet use at any location remained steady or grew among most demographic groups.[iv] Moreover, the proportion of U.S. households that lacked Internet at home and that had no members who used the Internet anywhere grew from 70 percent in 2013 to 77 percent in 2015.

Source: The Computer and Internet Use Supplement to the Current Population Survey

Source: The Computer and Internet Use Supplement to the Current Population Survey

Source: The Computer and Internet Use Supplement to the Current Population Survey

Source: The Computer and Internet Use Supplement to the Current Population Survey

Source: The Computer and Internet Use Supplement to the Current Population Survey

Source: The Computer and Internet Use Supplement to the Current Population Survey

Seniors, non-Asian minorities, and people with disabilities predominated as the reference persons[v] in households with the highest incidence of no Internet use at any location. No one went online from any location in 40 percent of U.S. households where the reference person had a disability, and in 37 percent of households where the reference person was 65 years or older. African American (28 percent), Hispanic (25 percent), and American Indian or Alaska Native (24 percent) households were most likely to have no Internet users at all, compared to White (19 percent) and Asian American (15 percent) households. 

In addition, no Internet use anywhere remained highest in households where reference persons had annual incomes below $25,000 (“low-income”), little educational attainment, or no job. Of low-income families, 39 percent did not include a single person who went online, compared to only 8 percent of households earning $100,000 or more per year. In terms of education level, households in which the reference person had not finished high school exhibited substantially greater frequency of no Internet use from any location (47 percent) than households of reference persons who had completed some college (15 percent) or had at least a bachelor’s degree (10 percent).

No Internet Use at Home

Despite a slight increase from 2013 to 2015 in the number of households without Internet at home, further examination of usage among specific demographic groups shows slight improvement. Additionally, among the 33 million households in the 2015 NTIA survey reporting no Internet use at home, 8 million included members who went online elsewhere; in 2013, 10 million of the 32 million households lacking home Internet went online elsewhere.

In terms of race, during this two-year period no Internet use at home declined in American Indian and Alaska Native households from 48 percent to 40 percent, and from 38 percent to 34 percent in Hispanic households. African American households’ non-use at home was stable at 38 percent during this period, while no home Internet use increased among White households by 2 percentage points to 24 percent, and by 3 percentage points among Asian American households to 18 percent.

Households with a disabled reference person were twice as likely as households with a non-disabled reference person to lack home Internet users (47 percent versus 23 percent). Nonetheless, non-use fell 3 percentage points in households with a disabled reference person and increased by one point for non-disabled households since 2013. 

Similarly, we observe a narrowing of the digital divide for the lowest-income families between 2013 and 2015. ‘No home Internet use’ fell for households with annual incomes below $25,000 from 51 percent in 2013 to 49 percent in 2015; remained unchanged at 30 percent for households earning between $25,000 and $49,999 annually; and increased among households with higher incomes. In fact, among those highest income households, earning at least $100,000 annually, the percentage of households without home Internet users more than doubled from 5 percent to 11 percent between 2013 and 2015. The digital divide is narrowing, in part, because higher income households are becoming somewhat less likely to use the Internet at home. Nevertheless, the traditional income divide remains critical: in 2015, households with annual incomes below $25,000 were more than four times as likely to have no home Internet users than households with incomes of at least $100,000 (49 percent versus 11 percent). 

Reasons for No Home Internet 

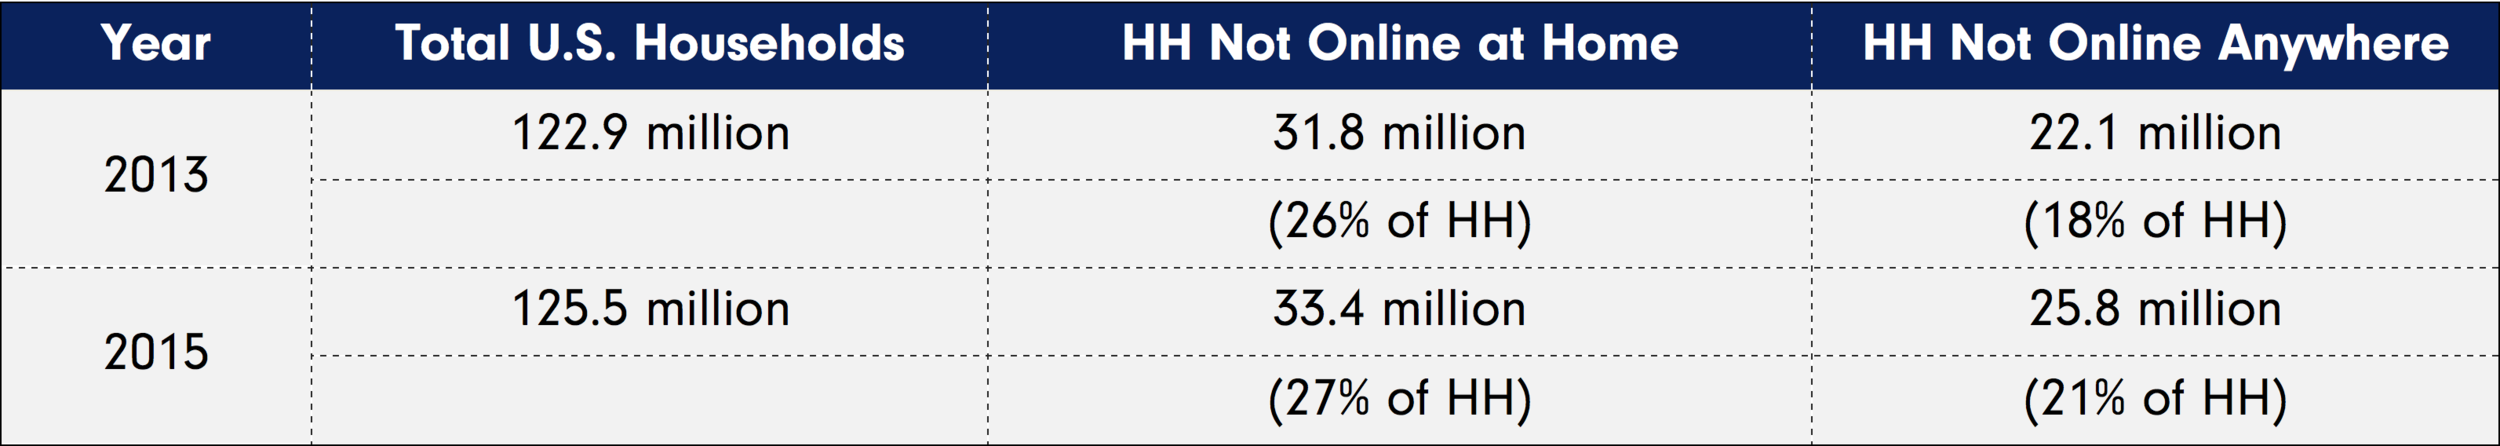
NTIA survey results from 2001 to 2015 reflect a consistent pattern regarding the primary reasons why some households refrain from using the Internet at home. These reasons include: 1) no need or interest; 2) expense; and 3) no or inadequate computer. As the figure above illustrates, from 2013 to 2015, the proportion of households not online at home due to no need or interest increased by 8 percentage points from 47 percent to 55 percent, while the percentage of households that did not use the Internet at home because of cost concerns or the lack of a serviceable computer decreased. Although the extent of the changes varied among demographics, rural or urban residence, or the presence of school-aged children at home, the trend remained the same. (See Appendix A)

The growing frequency of the lack of interest or need for home Internet service, even among higher educated, higher income, and White households that traditionally have exhibited the highest home Internet use, bears further study.[vi] Possibly, the uptick in this response could indicate diminishing reliance on home Internet connections. Fifteen years ago, getting online required a personal computer (PC) and a modem, which limited the locations where people could access the Internet outside the home. Since that time, the proliferation of Internet-enabled mobile devices has helped to mitigate the geographic limitations of previous technologies. Further, the makeup of the non-using population may have shifted over time. Although NTIA does not conduct longitudinal studies of individual households, to the extent possible, it will continue examining this trend in future surveys.

To better understand the reasons some households did not use the Internet at home, the 2015 survey provided more options for inteviewers to describe respondents’ non-usage. For instance, interviewers separated the previously combined ‘don’t need’ and ‘not interested’ answers and refined the ‘too expensive’ response into ‘can’t afford’ and ‘not worth the cost’ based on the interviewees’ replies.

Given these categories, of the 55 percent of households without home Internet use expressing a lack of interest or need for the service in the 2015 survey, 60 percent reported not needing the service, while the remaining 40 percent stated they had no interest. These more detailed reasons for no home Internet use may facilitate development of policies and programs that address the specific concerns of these households. For example, digital literacy programs that introduce non-users to online learning tools about topics that interest them could stimulate their desire to use the Internet at home. As for households that perceive no need for the service, information about Internet applications that help address specific educational, health, employment or other needs may persuade them that the convenience and privacy of home Internet access could improve their lives.     

Of the 24 percent of households without home Internet because of cost concerns, 92 percent explained they could not afford it, compared to a mere 8 percent that responded the service was not worth the cost. Cost still remains a barrier for a meaningful percentage of non-adopting households. Not surprisingly, households with annual incomes under $25,000 and between $25,000 and $49,999 stated that they could not afford the service at 27 percent and 21 percent, respectively, compared to 12 percent of households with incomes of $50,000 or more.

These more granular reasons for no home Internet use also shed light on the differences between households with members who formerly used the Internet at home and those that have never done so. Households with prior home Internet access appeared to be more price sensitive than households without any previous in home usage. Thirty-one percent of non-adopting households that once had home Internet responded that they could not afford the service, while only 20 percent of never-adopting households gave the same main reason. The data also suggest that households with prior home Internet connections appreciated the technology’s utility, and were far less likely to state they did not need it (21 percent) or were not interested in it (13 percent) compared to households that had never used the Internet at home because they did not need it (36 percent) or lacked interest (24 percent).

With the potential for under-reporting of households that consider Internet service as cost-prohibitive, a new 2015 survey question for households without home Internet asked whether they would buy the service if it was offered at a lower price. Responses revealed that 23 percent of all households that did not use the Internet at home in 2015 would purchase the service at a decreased cost. Significantly, half of households that had stopped using the Internet at home reported a willingness to subscribe to lower-priced service if available, while only 17 percent of households that never had home Internet gave the same answer.

Given the varying motivations for non-Internet usage at home, improved reach to these households will require more targeted approaches. To recapture those households that formerly used the Internet at home, eliminating or reducing cost concerns may offer an opportunity to narrow the digital divide. Alternatively, it could prove more challenging to convince those households that have never used the Internet to overcome their perception of its irrelevance in their lives.

As these trends demonstrate, although the digital divide may be waning in certain respects, it still is a significant problem overall. The survey results indicate that eliminating the divide may require policy interventions that precisely target specific populations and their reasons for not using the Internet. Programs that assist families unable to access desired Internet service could help ensure that all Americans can participate in the digital economy.

II. Persistent Urban/Rural Connectivity Gap

While the digital divide has narrowed among certain demographic groups since 2000, the longstanding disparity between urban and rural users persists and now appears in the adoption of more recent technologies, such as the smartphone and social media.[vii] This suggests that in spite of advances in both policy and technology, the barriers to Internet adoption existing in rural communities are complex and stubborn. In particular, rural residents who were part of a demographic group that was less likely to use the Internet nationally faced an even larger disadvantage than their counterparts living in a metropolitan area. Rural individuals with higher levels of education or family income, however, did not have significantly lower adoption rates than their urban counterparts.

As the figure illustrates, the connectivity gap between rural and urban populations has continued throughout the last 15 years. The data indicate a consistent 6 to 7 percentage point divergence between rural and urban communities’ Internet use.

Factors Compounding the Rural and Urban Gap

Among the rural population, certain segments face a particularly large digital divide. For instance, the figure above captures how race factors into the spread of Internet usage among as 70 percent of Whites in rural areas had adopted the Internet, compared to 59 percent of African Americans and 61 percent of Hispanics. The rural-urban Internet adoption gap compounds the traditional digital divide, resulting in particularly low usage among African Americans and Hispanics in rural areas.

This gap between urban and rural residents’ Internet use also varied by family income. The data show the biggest gap in Internet use between rural and urban Americans based on income was among those with incomes between $25,000 and $49,999; 66 percent of rural residents in that income range used the Internet, compared with 70 percent of their urban counterparts. In contrast, rural residents earning between $75,000 and $99,999 adopted the Internet at about the same rate as their urban counterparts.

The discrepancy between rural and urban users was particularly high for those without a high school diploma. As shown in the figure below, only 52 percent of rural residents who lacked a high school diploma reported using the Internet, compared with 59 percent of those in urban households with a similar level of education. The gap was slightly smaller for high school graduates, where 63 percent of rural residents reported Internet use compared with 69 percent of urban residents. In contrast, rural and urban college graduates used the Internet at approximately the same rate.

Urban/Rural Gaps Beyond Internet Adoption

Beyond connectivity at home, those living in a rural area also exhibited lower levels of device use, Internet use at particular locations, and participation in online activities.

Overall, rural users were less likely than their urban counterparts to report using a desktop (29 percent for rural users versus 35 percent for urban users), a laptop (39 percent versus 48 percent), a tablet (24 percent versus 30 percent), or an Internet-enabled mobile phone (45 percent versus 54 percent). Rural users were also less likely to use the Internet from home (61 percent versus 69 percent) and at work (22 percent versus 29 percent).

In terms of online services and functions, rural residents who indicated they did use the Internet were still less likely than urban residents to use email (86 percent versus 92 percent), social media (68 percent versus 71 percent), and online video or voice conferencing (28 percent versus 38 percent) than Internet users in urban areas. While some of these differences may seem relatively modest, they are statistically significant. Lastly, rural individuals were more likely than their urban counterparts not to own any Internet compatible devices (33 percent versus 26 percent), and were less likely to own more than one device.

These results point to a continuing need to address the obstacles rural residents and others face in Internet use. For instance, some households may require subsidies to make the Internet more affordable, while others may need digital literacy training to understand the usefulness of the Internet in their lives. Even today, some remote rural communities still lack Internet access at all, or the service available may be poor or expensive due to such factors as a lack of competition for providers (FCC 2015).

The latest data underscore the work still required to ensure Americans in all communities have access to affordable broadband as well as the digital skills to realize the many benefits that come from the Internet. Moreover, there may be important differences between rural and urban non-adopters that policymakers need to consider when tailoring programs to specific communities.

III.  Single-Device Users

In a world increasingly connected by a myriad of devices, certain groups of Internet users, especially those with limited income or education, only have access to a single type of Internet-connected device. Many of the same demographic groups that have historically had low adoption rates are also more likely to only use a single type of device when they do use the Internet. One connected device, however, may not be enough to perform a full range of online activities. Indeed, single-device users reported participating in fewer online activities compared to those with more than one type of device.

Using a single type of computing device appears to correlate with particular online activities undertaken. Additionally, users of different devices may vary in their online interactions. The data demonstrate that PC-only users were less likely to consume entertainment or social media, while smartphone-only users were less likely to engage in online financial or professional activities. This suggests that the digital divide is evolving to include a spectrum of under-connectedness. Understanding the demographic characteristics of single-device users, the types of devices they own, and the range of online activities undertaken will help inform policymakers’ efforts to address this evolving digital divide.[viii]

Based on the 2015 CPS Computer and Internet Use Supplement, 77 percent of Internet users ages 15 years or older reported utilizing some combination of a desktop, laptop, smartphone, and other device(s), while 18 percent only used a single type of device.[ix] Single-device respondents were further classified according to the type of device they used to connect to the Internet—PC (either desktop or laptop), smartphone, or tablet. Of single-device users, most (62 percent) report only using a PC, roughly a third (32 percent) are smart-phone only, and handful (4 percent) connect through a tablet.[x]

Single-Device Users

The average number and type of Internet-connected devices used varied by demographic group. Single-device users tend to be older (average age of 47 years versus 42 years for multiple-device uers), low-income (30 percent of Internet users with family incomes below $25,000 reported using only one type device versus 8 percent with family incomes of $100,000 or more), and less educated (30 percent of Internet users lacking a high school diploma stated they used only one device).

As the figure illustrates, the use of multiple device types was most common at the highest income ranges, as 90 percent of Internet users with incomes of $100,000 or more were multi-device users, compared with 61 percent of those in the under $25,000 range.

The figure above illustrates a similar effect of education levels.[xi] The percentage of multi-device users increases with greater education attainment.

PC, Mobile, and Tablet Only Users

However, even among single-device users, clear differences in age, family income, race, and education level correlate to the type of device used.

As shown in the figure, on average, mobile-only users were younger than their PC-only counterparts. Whereas the average age of PC-only users (54 years) and tablet-only users (51 years) was older than their multi-device peers (42 years), the average age of mobile-only users is just 39 years.

Along with age, race also varies among different single-device user communities. Although both single-device and multi-device users were predominately White, Hispanics and African Americans had some of the highest mobile-only usage rates of any racial or ethnic group in the country: 14 percent of Hispanic Internet users and 12 percent of African Americans were mobile-only users, compared to 4 percent of Asians and 6 percent of Whites.

As shown in the figure, 48 percent of single-device users in households with annual incomes under $25,000 used a smartphone exclusively, compared with 35 percent of their peers in households with incomes of $100,000 or more. For comparison, 45 percent of single-device users in the under $25,000 category relied on a PC, versus 59 percent of those with household incomes of $100,000 or more.

Single device users were also more likely to rely on a smartphone than a PC when they had lower levels of educational attainment.

Single device users were also more likely to rely on a smartphone than a PC when they had lower levels of educational attainment. As shown in the figure below, 56 percent of single device Internet users lacking a high school diploma only used a smartphone, compared to 26 percent of those with a college degree. In contrast, 69 percent of single device users with a college degree used a PC.   

Online Activities of Single-Device Users

Understanding the demographic profiles of multi-device and single-device users in terms of the type and number of connected devices can shed light on populations unable to take advantage of the full range of online activities. Since features, such as screen and keyboard size, mobility, security, and available software and apps, vary among device types, so does the ability to perform important online activities.

Single-device users were also less likely to engage in nearly all online activities surveyed.[xii] In particular, 47 percent of single-device users engaged in e-commerce activities compared to 76 percent of multi-device users. Such a situation means that single-device users may be missing opportunities to access competitive prices and a wider range of goods and services, particularly in areas not well served by brick and mortar establishments.

Single-device users also appear to miss out on employment opportunities and potential for job flexibility.[xiii] Only about 8 percent of single-device users had teleworked in the 12 months preceding the survey in contrast to 26 percent for multi-device users. As for job searches, 22 percent of single-device users had gone online to seek out employment as compared to approximately 29 percent for multi-device users. Interestingly, while teleworking varied only slightly among different types of single-device users—9 percent of smartphone-only users teleworked, compared with 7 percent of PC-only users—those with smartphones were considerably more likely to search for a job online (28 percent) compared with their PC-only peers (17 percent). This may be attributable in part to demographic differences between the two groups, including the aforementioned age differences.

Differences in online engagement between multi- and single-device users extended into online health, entertainment, and social spaces. While only 34 percent of single-device users went online to obtain health-related information, more than half of multi-device users did so. As patients increasingly rely on online resources to efficiently manage their medical care, single-device users may face a serious disadvantage.

Disparities between these types of users also emerged in engagement levels in social and entertainment related online activities. While 57 percent of single-device users participated in some form of online social network and 81 percent used email, 75 percent of multi-device users were on social networks, and 95 percent used email. Similarly, single-device users were less likely to consume online audio (36 percent) and video materials (50 percent), whereas large majorities of multi-device users listened to and watched online audio (60 percent) and videos (73 percent).

Distinct Internet usage among single- and multi-device users persist even among people with similar levels of family income or education. For example, while use of the Internet for e-commerce was more common among those with higher income and education levels, single-device users in all categories were less likely to purchase goods or services online than their peers using multiple types of devices. Interestingly, online social networking did not clearly have the same direct relationships with education and income as telework and e-commerce, but even in this instance, multi-device users were more likely than single-device users to partake in this activity.

The online activities of mobile-only and PC-only users also diverge. As shown in the figure below, proportionally, more mobile-only users connected to the Internet for entertainment and social activities, while proportionally more PC-only users accessed online health and financial resources. Of single-device users, a larger percentage of mobile-only users went online to text, engage in social networks, listen to audio, and watch videos. Conversely, a greater proportion of PC-only users engaged in email, e-commerce, financial activities, retrieval of health information, and examination of online health records.

More specifically, 69 percent of surveyed mobile-only users engaged in social networking while less than half of PC-only users did so. While 89 percent of mobile-only users sent texts or instant messages (IM), only 56 percent of PC-only users used text or IM. More than half of mobile-only users watched videos online, compared to only 40 percent of PC-only users. Conversely, about 85 percent of PC-only users used email, whereas 76 percent of mobile-only users used email. When it comes to health-related information, 36 percent of PC-only users went online for health information and 16 percent checked their electronic health records; 31 percent and 12 percent of mobile-only users did so.

The digital divide has evolved from a binary issue of access to the Internet to a multi-dimensional divergence that disproportionately affects vulnerable populations.

These findings show that the number and type of connected devices can affect the manner of Internet usage in ways that may have profound consequences for users. Single-device users appear to be less affluent, educated, likely to search for jobs, participate in online commerce, find health information, join social networks, and even email when compared to their multi-device counterparts. This limited or non-participation may have important implications for single device users’ ability to engage fully in civil society. Of particular concern may be the adverse social and economic effects that could result from often less affluent and educated mobile-only users eschewing financial, professional, or health-related activities.

Conclusion

These results suggest that the digital divide has evolved from a binary issue of access to the Internet to a multi-dimensional divergence that disproportionately affects vulnerable populations, which has subsequent economic and social implications. Policymakers must establish a better understanding of Internet usage to ensure that all Americans can participate and engage online in accessible ways. In particular, they should target policies according to the specific barriers confronting diverse communities so as to better address the various aspects of the digital divide.

IMG_0110.JPG

+ Appendix A

alt text

+ Endnotes

  1. The survey supplement began with two simple questions: "Does someone in this household own a personal computer?" and "Is there a modem for the computer?" Subsequent questions asked about plans to buy a computer or modem, and types of activities performed with the computer and modem.
  2. Between 2000 and 2010, Internet usage increased with every Computer and Internet Use supplement from 44 percent to 72 percent of Americans ages 3 and older. See NTIA Data Explorer at: https://ntia.doc.gov/data/digital-nation-data-explorer. (Metrics selected: "Uses the Internet (Any Location)").
  3. The Census Bureau surveyed 53,000 households for NTIA's July 2015 Computer and Internet Use Supplement to the CPS. For more details on the 2015 or previous survey supplements, see NTIA's Data Central available at: https://ntia.doc.gov/data.
  4. During this period, estimates of Internet use in the households of Native Americans and Alaska Natives, Americans 65 years or older, and people with disabilities increased, though statistical significance varied.
  5. The reference person is not necessarily, but may be, the same person who responded to the survey. A reference person is the individual primarily responsible for renting, owning, or maintaining the household's dwelling. In collecting and reporting NTIA survey data, the Census Bureau attributes the reference person's demographic characteristics to the entire household. We follow that practice throughout this paper so that the reference person's age, race, ethnicity, disability status, education, employment status, family income, and gender, among other characteristics, represent those of the household. More specifically, the Census Bureau defines the household reference person as "the person to whom the relationship of other people in the household is recorded. The household reference person is the person listed as the householder (see definition of "Householder"). The subfamily reference person is either the single parent or the husband/wife in a married-couple situation" (U.S. Census Bureau 2015). Householders are the individuals 15 years or older who rent, own, or maintain the housing unit.
  6. The survey did ask about mobile and wired Internet use at home. Based on the results, NTIA does not attribute this lack of interest to a growth in mobile usage and have separately reported on a shift toward mobile-only usage (McHenry 2016).
  7. The designation of rural versus urban in NTIA surveys is based on whether the respondent lives in a Metropolitan Statistical Area (MSA). Urban households live within the MSA, whereas rural households represent those outside the MSA. Based on this designation, 14 percent of U.S. households are considered rural.
  8. We have previously reported that the average number of connected devices is increasing, and that people are using the Internet in more places and performing more activities online. According to the 2015 supplement, the proportion of all Americans ages 3 and older using at least two types of Internet-connected devices grew from 52% to 57% between 2013 and 2015. (McHenry 2016). Due to a difference in statistical sample, these numbers vary slightly from those discussed in this current report. Here we focus on Internet users ages 15 years and older, as opposed to all Americans ages 3 and older in the previous blog post.
  9. An additional 5 percent of Internet users did not identify as using any of the device types asked in the survey.
  10. Of the 8,916 single-device users, 5,545 respondents were categorized as 'PC-only users', 3,008respondents were labeled as 'mobile-only users', and 363respondents connected through a tablet and were labeled as 'tablet-only users'.
  11. Because income and education are correlated, their effects are often linked, and attempts to distinguish income effects from education effects (and vice versa) are difficult due to multicollinearity between the two variables.
  12. NTIA also asked about online conferencing, location services, connected household equipment, and health monitoring. The relative levels of usage of these activities are consistent with the ones discussed here. For more information on these activities see NTIA's July 2015 Digital Nation Dataset.
  13. These data were also taken from the responses to the U.S. Census Bureau's July 2015 Current Population Survey. In the Computer and Internet Use Supplement portion, randomly selected Internet users above the age of 15 answered questions regarding the online activities performed when they connected to the Internet. These activities included use of (1) email, (2) text or instant messaging, (3) social networks (e.g. Facebook or Twitter), (4) video or voice calls, or video conferencing over the Internet, (5) Web browsing, (6) videos over the Internet (e.g. YouTube or Netflix), (7) streaming or downloading music, radio programs, or podcasts online, (8) on-the-go services such as maps, GPS, or reviews of nearby businesses, (9) the Internet for telecommuting, (10) the Internet to search for a job, (11) the Internet for educational classes or job training, (12) the Internet for financial services such as banking, investing, or paying bills online, (13) online shopping, travel reservations or other consumer services, (14) the Internet to interact with household equipment such as a connected thermostat, light bulb, or security system, (15) the Internet to research health information online (e.g. WebMD), (16) the Internet to communicate with a doctor or access health or health insurance records online, and (17) a health monitoring service that connects to the Internet.

+ References

Burt, S. and Sparks, L. 2003. "E-commerce and the retail process: a review." _Journal of Retailing and Consumer Services _10(5):275-286.

Federal Communications Commission (FCC). 2015. 2015 Broadband Progress Report and Notice of Inquiry on Immediate Action to Accelerate Broadband. https://www.fcc.gov/reports-research/reports/broadband-progress-reports/2015-broadband-progress-report.

McConnaughey, J., Nila, C.A., and Sloan, T. 1995. Falling Through The Net: A Survey of the "Have Nots" in Rural and Urban America. https://ntia.doc.gov/ntiahome/fallingthru.html.

McHenry, G. 2016. "Evolving Technologies Change the Nature of Internet Use." NTIA Digital Nation Blog. https://ntia.doc.gov/blog/2016/evolving-technologies-change-nature-internet-use.

Morris, J. 2016. "First Look: Internet Use in 2015." NTIA Digital Nation Blog. https://ntia.doc.gov/blog/2016/first-look-internet-use-2015.

National Telecommunications and Information Administration (NTIA). Digital Nation Data Explorer. 2016. https://ntia.doc.gov/data/digital-nation-data-explorer.

U.S. Census Bureau. 2015. "Current Population Survey (CPS) Subject Definitions." http://www.census.gov/programs-surveys/cps/technical-documentation/subject-definitions.html#referenceperson.

Dr. Giulia McHenry is the Chief Economist at the National Telecommunications and Information Administration. She is an expert in the economics of the Internet, telecommunications, and media. She advises on a range of issues including broadband policy and adoption, the digital economy, and the economics of spectrum and spectrum management. Previously, she worked at the Brattle Group, providing expert economic consulting work to a range of industrial clients. She received her BA from Wesleyan University and her PhD in economics from The University of Maryland.

Maureen Lewis is the Director of the Minority Telecommunications Development Program at the National Telecommunications and Information Administration, a position she has held since January of 2000. As the director of the program, Lewis is responsible for developing policy and analyzing proposed legislation and regulations to increase minority ownership of broadcast and telecommunications enterprises. Prior to her work with the NTIA, Lewis served as general counsel of the Alliance for Public Technology. She has a BA from Spelman College and a JD from Georgetown University Law School.

Rafi Goldberg is a policy analyst with five years of experience with the National Telecommunications and Information Administration. The broad scope of his work includes examining data on computer and Internet use in the United States, as well as analyzing policy issues ranging from intellectual property to perceptions of online privacy and security. He received his BA from Tufts University and his MPP from Georgetown University’s McCourt School of Public Policy.

Edward Carlson is a policy analyst with the National Telecommunications and Information Administration. A multi-year veteran of the department, he focuses on broadband deployment and traditional telecommunication issues like intercarrier exchange. Formerly, he was a legislative advisor with the New York City Mayor, where he focused on telecommunications and technology issues. He received his BA from Colorado College and his JD from The University of Iowa School of Law.

Justin Goss is a second year Master of Public Policy student and hails from the Silicon Valley area and migrated a short two hours north to the pastoral lands of Davis, CA where he majored in Political Science and Philosophy amongst the bovine co-residents Davis is best known for. He has experience working in government at the Federal and State levels.

Celeste Chen is a graduate student at the McCourt School of Public Policy at Georgetown University, where she focuses on the intersection of emerging technology, science, and policy. She served as a graduate intern at the National Telecommunications and Information Administration at the Department of Commerce during the summer of 2016 and is currently working in the Industry, Innovation and Science Branch at the Embassy of Australia. She received her Bachelor of Science in Neurobiology and Studio Art in 2014, also from Georgetown University. 

IMG_0117.JPG